与英文对照
与英文对照
Edit: Numbers from RobinHood case are alleged so far, not proven. I cannot edit the post title. That being said, results of Deep ITM CALLs comes up with roughly the same 226.42%, which is quite telling. We also see that PHLX exchange is used to buy and exercise these calls almost immediately - exactly as outlined in the SEC document on how to shift a short position to become synthetic. 0. Preface
与英文对照
I am not a financial advisor and I do not provide financial advice. Thoughts here are my opinion, and others are speculative. Shout out to king /u/broccaaa for their contributions. I always figured that your assumptions were correct that the SHFs were using these Deep ITM CALLs to hide SI%, but we never got some quick maths behind it to see if it was true. (Maybe we did though! Sorry if I did not see anyone's posts about this) Well, this is for you /u/broccaaa, and all the apes.

与英文对照
Spreading Love To All
与英文对照
1. GME SI% Is A Minimum Of 226.42%; Shorts Were Hidden With Deep ITM CALLs
与英文对照
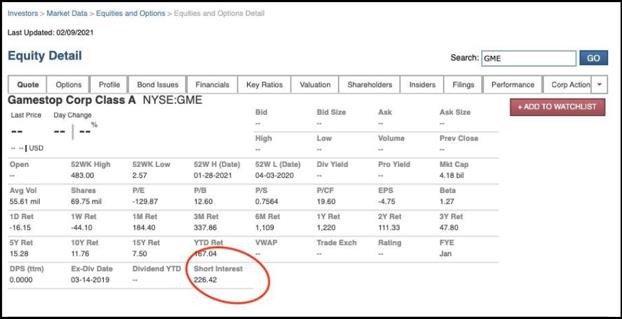
Way way back in time, since many of you probably feel like you've aged years over the course of 6 months, there was a blip of 226.42% SI in January. Many believed this was a glitch:
与英文对照
https://www.reddit.com/r/GME/comments/lgjztf/wtf_is_going_on_with_finra_is_it_7846_or_22642/
与英文对照
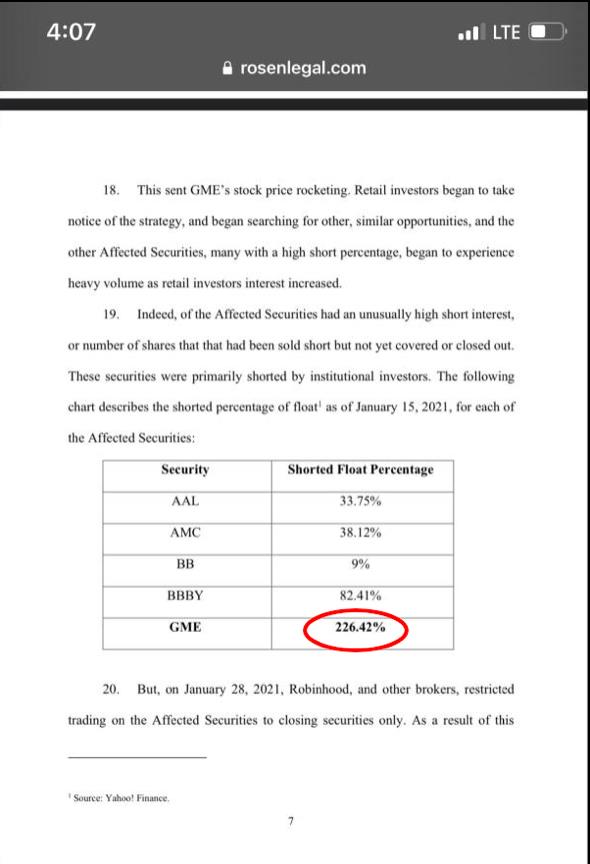
That's what many may have thought, that it was just a glitch, until recently a Class Action against RobinHood proved that was, indeed, the SI% upon January 15th, 2021: Edit: Thank you much for everyone's replies. We must consider this as still speculative and not proven as it is a number alleged by the plantiff. Allegedly, per a Class Action against RobinHood, the SI% was 226.42% upon January 15th, 2021:
与英文对照
https://www.reddit.com/r/Superstonk/comments/o6mp0c/from_class_action_against_rh_look_at_that_juicy/
与英文对照
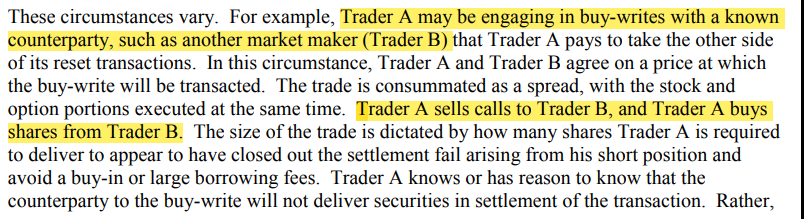
Put yourself in the SHF's shoes. You have a shitload of retail buy pressure going on. You're way overshorted. What do you do? Do you cover? Pfft. Nah. That's way too much. Impossible to cover. Absolutely screwed. Lucky for you the SEC has identified malicious options practices which can be used for just such an occasion to make it appear that you've covered. Let's say you want to make it "appear" that you covered your short. You can perform a buy-write trade with a bona-fide Market Maker. Who might help you out as a bona-fide Market Maker? Citadel might come to mind (not saying it's them, just an example since they are well known)! The trade ends up being the following: 1. Trader A who needs to hide their short position enters the buy-write trade with Trader B (Citadel). 2. Trader A sells a Deep ITM CALL to Trader B (Citadel). 3. Trader A simultaneously buys shares from Trader B (Citadel). 4. Trader A now appears to have purchased shares to cover their short position, and Trader B (Citadel) gets a small amount of cash in return.
与英文对照
• They tend to trade Deep ITM CALLs that have little to no OI so that the trade is almost与英文对照
guaranteed to be between Trader A and Trader B.
与英文对照
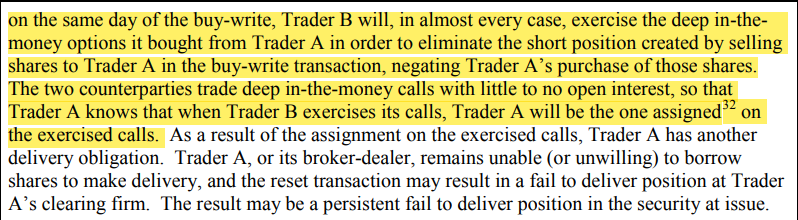
• Trader B tends to exercise these CALLs on the same day. And this is exactly what we 与英文对照
have been seeing because CALL OI does not increase.
与英文对照
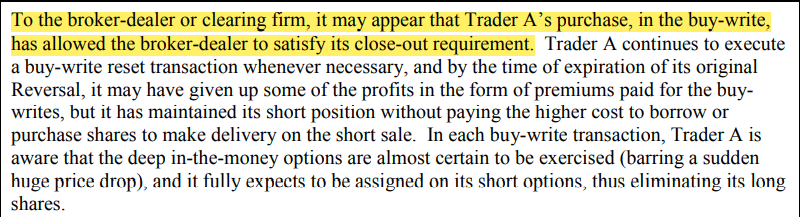
• The net effect on this is that Trader B has looped around their shares. They sold them to与英文对照
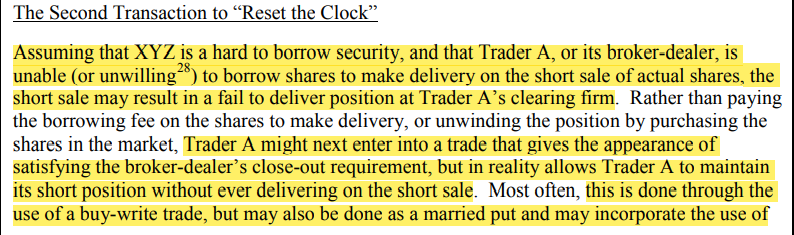
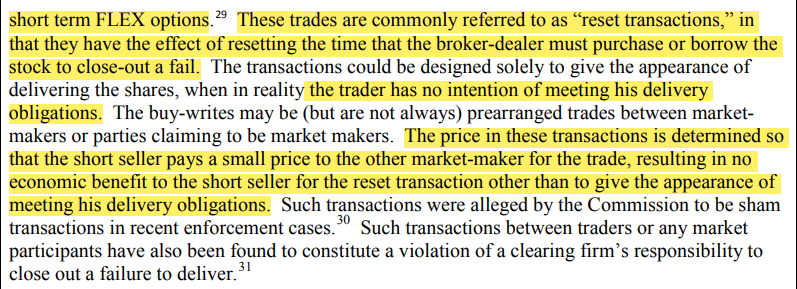
Trader A, and then got them back through exercising the CALL. Meanwhile, Trader A has "covered" their original short position but now they are "short" the CALL, meaning it is now a synthetic short. Here is the supporting text from the SEC itself if you want to verify for yourself. A report from 2013 titled "Strengthening Practices for Preventing and Detecting Illegal Options Trading Used to Reset Reg SHO Close-out Obligations":
与英文对照
https://www.sec.gov/about/offices/ocie/options-trading-risk-alert.pdf Section II
与英文对照
https://www.sec.gov/about/offices/ocie/options-trading-risk-alert.pdf Section II

与英文对照
https://www.sec.gov/about/offices/ocie/options-trading-risk-alert.pdf Section II
与英文对照
https://www.sec.gov/about/offices/ocie/options-trading-risk-alert.pdf Section II
与英文对照
https://www.sec.gov/about/offices/ocie/options-trading-risk-alert.pdf Section II
与英文对照
https://www.sec.gov/about/offices/ocie/options-trading-risk-alert.pdf Section II
与英文对照
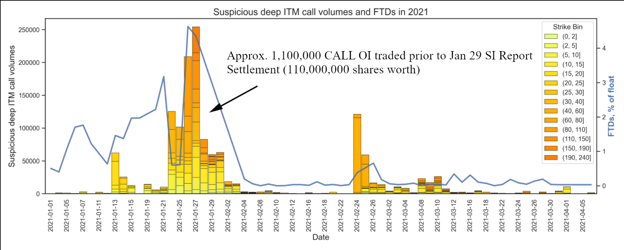
So, they can utilize Deep ITM CALLs to hide their short positions. We don't care about identifying Trader A and Trader B in this case. Just the fact that trades occurred on these Deep ITM CALL strikes and that OI is unaffected the day thereafter. That's enough to support the above theory that they're utilizing this practice to make it 'appear' that they've covered their short position. Check out what /u/broccaaa's data identified. Tons and tons of Deep ITM CALLs were traded in January prior to SI% dropping off of a cliff. By my estimations, about 1,100,000 CALL OI was traded prior to January 29th SI Report Date:
与英文对照
/u/broccaaa Data on Deep ITM CALL Volumes Vs FTDs of GME
与英文对照
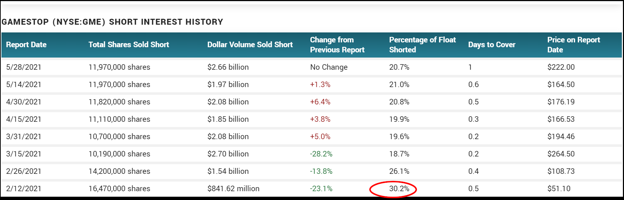
The SI Report Date of January 29th matters because that is the cutoff of when FINRA will require settlement of short interest numbers for the next SI report date. The next SI report date following January 29th settlement is February 12th. And we can see that after the mayhem of Deep ITM CALL purchases, SI% dropped from 226.42% of the January 15th report, to 30.2% upon February 12th:
与英文对照
https://www.marketbeat.com/stocks/NYSE/GME/short-interest/
与英文对照
With the difference in SI% from 226.42% on January 15th down to 30.2% on February 12th, we can assume that they have not covered their short position but rather hid their short position in synthetics if we can come up with a roughly equivalent SI% from the approximate Deep ITM CALL purchases. The float of GME in January was approximately 57,840,000. The estimated Deep ITM CALL OI that was swapped is ~1,100,000 OI = ~110,000,000 shares worth. Which then gives an estimated SI% reduction of ~110,000,000 / 57,840,000 = ~190.18% shorts hidden between January 15th and February 12th report date. And since SI% on February 12th was 30.2%, then that gives a grand total of 190.18% + 30.2% = 220.38% SI per estimations. That's dangerously close to the reported 226.42% SI from January 15th. So with that in mind - do you think they covered?

与英文对照
Estimations of SI% Based on Deep ITM CALL Purchases Up To January 29th