与英文对照
与英文对照
Sup apes not financial advice in the slightest. Before I begin this analysis post, if you question the validity of fibonacci and Elliott Wave because it has proven to be "incorrect" you are approaching this topic with the wrong mindset. Fibonacci and EW are quite literally the "formula" to the stock market, but its much easier to understand than it is to implement. GET FUCKING HYPEEEE!!!! Obligatory crank: https://www.youtube.com/watch?v=Phy75VJRObQ Spotify link: https://open.spotify.com/track/21UoRIOIjkWdHU8xbxQ0Z7?si=1958348bf5524bf0 As always, I post intraday analysis on my twitter to provide updates on what I see, if you're interested in the snippets/BTS charting, you'll love it. In this post I am going to be going over mainly GME and touch on a few indices. First off, if you've been reading my posts for a while, you'd know I was on the lookout for the current trend to hold above 197 for my wave count to be correct. Friday and today we broke below this level, seeing a low of 193.71. Wut mean you ask? All this means is that the count I was analyzing on a smaller scale was invalidated, as we broke below the original supposed low target of 197. In lehman's terms, instead of a 3 within a 3 within a 3 within a 3, the updated trend will be a 1 within a 3 within a 3 within a 3. basically, nothing is changed. I am also very well aware that bad actors read my and other's analysis and act on it as an attempt to attack the validity of not only technical analysis but members of the sub that are looked up to for their
与英文对照
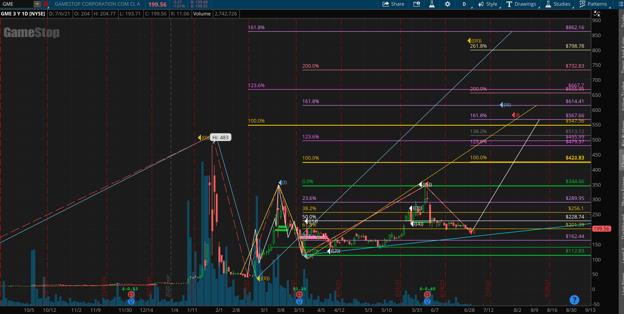
analysis. To the shorts that do this, I say fuck you, pay me. I have happily added more shares under 200, that's a fucking steal if you ask me. Here's my updated chart factoring in today's low, simplified (I cleaned my shit up big time)
与英文对照
Daily
与英文对照
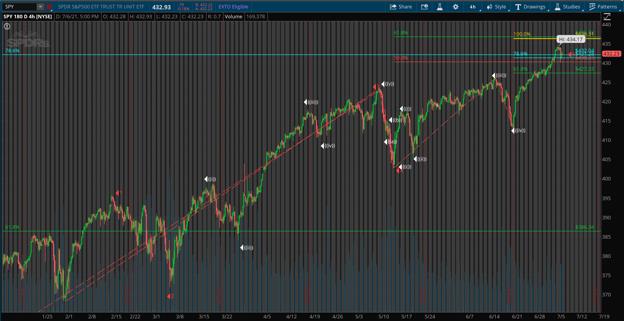
Note, the only targets changed from the recent downward pressure (white line/red annotation). All larger scale targets remain the same, the only way the latter would be invalidated is if we broke below 112.83 (yellow line target) and 38 (blue line target) The white (3rd largest degree) will go down proportionate to how much downside we have from hereon out. example, the 1.618:1 ideal wave 3 target factoring in today's low of 193 comes out to 567.66. If we drop to a low of 190 in the next few days before continuing up, then the updated 3 target would be 564.66. My biggest reason for writing this is to clear up some misconceptions I have heard regarding the wave structure. So idk about you, but I could care less about what happens in the short term. The overarching setup is (as always) screaming buy. However, in terms of my previous prediction of 197 being the low, this fell through as we broke below the smaller scale wave 1 low. Remember, for a motive (5 wave impulse) structure, wave 2 cannot retrace into the territory of your wave 1, otherwise you must redraw. There is NO exception for this rule. Before I continue with GME, I would like to shed more light on my $SPY analysis . I still hold my 432 top target, I just want to go a bit deeper in the analysis. I was considering making another youtube video so you could see how I analyze and draw targets, but I'll save that for another time. I do want to thank you all for the insane amount of support on my first (and only) GME SPY EW video Here's what I see on a 4hr view:
与英文对照
4hr
与英文对照
Monthly:
与英文对照
Monthly
与英文对照
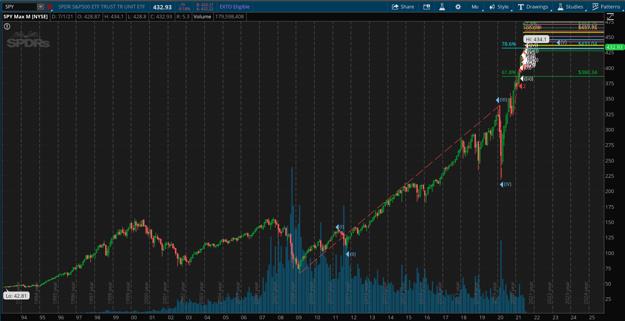
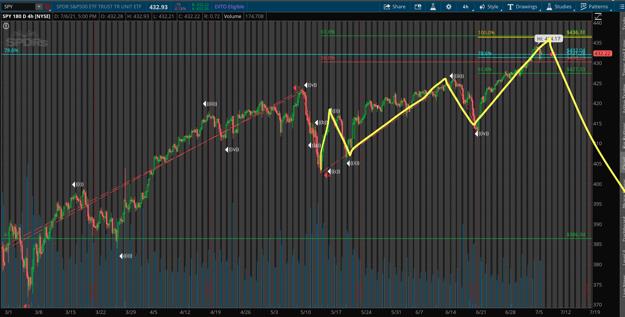
Without a doubt, SPY is ridiculously extended to the upside. I believe we will see 436 hit in the near future at the very least, highly doubt much more upside from there. My reasoning for this is remember that EW is a fractal trading strategy, meaning targets on a smaller timeframe line up to form larger time frame targets.
与英文对照
visualized
与英文对照
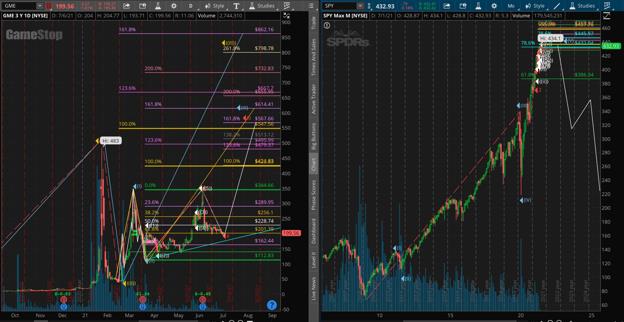
You can see the 5 wave structure from the recent lowest low, normally wave 4 can't retrace into the territory of 1, however keep in mind the overarching wave is a 5, meaning 4 CAN retrace into the territory of 1. This trips a lot of new EW traders up as they don't understand the rule of diagonals. regardless, wave 5 usually targets .618 - .786 of 1. the .618 level of this move comes out to 436, where the bigger cycle 5 next target comes out to 436 as well (1:1 level, yellow). an extension of above .786 for a wave 5 is considered to be extended for what it's worth. The yellow trajectory I drew is only for visualization purposes and in no way is saying this is exactly how SPY will play out in relation to price/time. the reason I'm talking so much about SPY here is because GME and a little something called negative beta. in short, market go down, GME go up, and vise vera, though correlation does not mean causation all the time. The market being near the top and GME near/at the bottom of the trend is interesting when you compare the two, and the supposed trajectory of each from hereon out using EW:
与英文对照
visualized
与英文对照
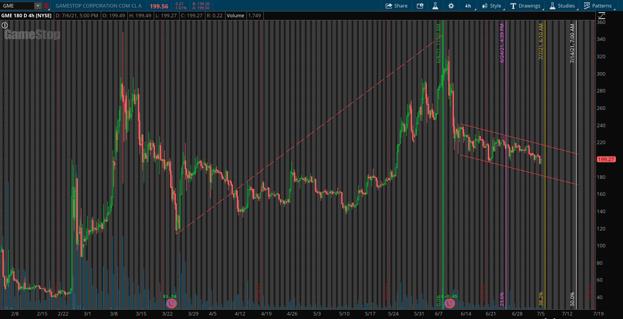
again, do note the white lines on SPY are only for visualization purposes, see my SPY DD for in depth retracement targets for our seemingly imminent bear market. SPY near top and GME near bottom, hmmmm... In terms of GME downside should this not be the bottom, super dumbed down, here's the channel GME is traveling in with fib dates worth keeping an eye on:
与英文对照
channel in red, time extensions colorful
与英文对照
Fibonacci time extensions can also be used to predict when a wave will change trajectory. In this scenario, I measured the length of the 1 (from 113 to 344) to get fibonacci numbers in relation to this time period. Stocks often need to cool off/consolidate after big moves before continuing the original trajectory. Totally normal in the stock market. However, given that GME is incredibly manipulated, take these fib dates with a grain of salt. I personally don't use them often with GME, though on other tickers I have found it to be quite profitable. Not that I endorse GME day trading at all, because you shouldn't, though when trading NORMAL (key word) tickers, Ideally, when swing trading, you load a full position a bit after the first upwards move, and use fib time extensions to predict when the corrective wave will end. In this scenario, the 38.2 time extension comes out to tomorrow, which signals a potential reversal coming tomorrow. Wednesday is also notorious for erratic GME movement, so stay buckled up! What's realllllllly fucking interesting is the 50% time extension comes on the notorious 7/14 date. What I want you to take away from the above visual is in the event that our reversal doesn't begin tomorrow from today's low, lower bound of the channel comes out to around 175. Just keep an eye on that level for some insane cheapies if Shitadel decides to abusively press the short button. All in all, GME is incredible bullish and those that hodl through this wave 2 will be handsomely rewarded. This I can guarantee. Fibs don't lie.
与英文对照
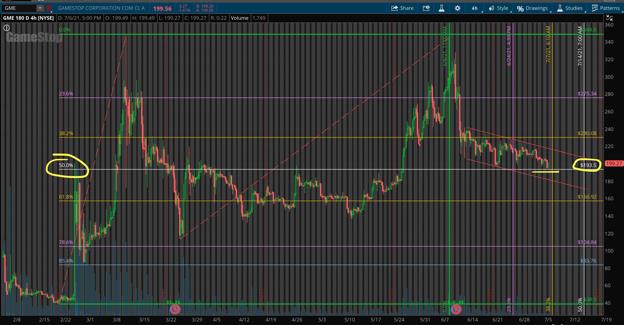
What make's me think today COULD be the low is, you guessed it, significant fib levels. This time, I measured the low of february to the high of march (second highest degree of waves), visualized:
与英文对照
4hr
与英文对照
Fib level? 193.5. Today's low? 193.71. so close to .69 :') Until we have significant upwards pressure, I won't have narrowed down smaller timeframe upside targets, but larger timeframe targets are still valid. It will be very hard to break the overarching setup for the shorts. I'm out. Thanks for reading 🍌 Time to go get high af and stare at fib levels some more. TLDR: Boom soon, Market near/at peak, GME at/near bottom, negative beta, GME to 8+ figures is not a meme and will happen if you believe and hodl for it. I know I will 🚀