Сравнить с английским
Сравнить с английским
0. Preface
Сравнить с английским
Not a financial advisor. Yada yada. If you actually listen to me you might want to get your brain checked for crayons. Probably no need for any more DDs from me after this one - its a cumulation of my thoughts over the past few months. People were interested in an SI% estimate so I thought, hell yeah, that's interesting shit. Why not? On a side note, I've learned pretty much everything I have about the stock market from Peppa Pig. Good stuff. Definitely recommend.

Сравнить с английским
Once again I'll be referencing charts from the mastermind /u/broccaaa and their post The Naked Shorting Scam. Go read that shit. Seriously. Also, sorry. TLDR is very difficult besides the bullets of Section 0 and my calculated result in Section 2.
Сравнить с английским
0. What's Going On Here?
Сравнить с английским
I've posted a few DDs in the past, and have basically come to the conclusion of the following per the data I've seen. I'll show you a few charts from /u/broccaaa's post to support this:
Сравнить с английским
• The price movements we've been seeing, both volatile moves up and down, are Сравнить с английским
caused by the shorters themselves by holding back buy pressure and then unleashing it at a later date. They are the reason we see bursts of high volume and large surges on certain days. This is due to the "SI Report Loop" that they're trapped in, paired with the fact that there are no more shares left in GME and there have been no shares for quite some time. I'll go into more detail in the next section because it is the basis of the SI% calculation.
Сравнить с английским
o They held back buy pressure from May 1 to May 12, and then it Сравнить с английским
started to be unleashed on May 13. Refer to Section 1 where I discuss the SI Report Cycle.
Сравнить с английским
• I do not believe they are delaying FTDs or hiding FTDs. Ever. They are satisfying themСравнить с английским
immediately with fake shares and simply hiding their ever-growing SI%. This is why we never see the "FTD squeeze" theory play out. They aren't juggling a pile of FTDs - they're simply adding to their ever growing short position until they inevitably get margin called from too high of a risk. (Hello??? Reverse repo loans coming out at higher frequencies lately?!)
Сравнить с английским
• Each type of option is used for a very specific play. We see large purchases of OTM PUTs,Сравнить с английским
ITM PUTs, OTM CALLs, and ITM CALLs popping up in anomalies.
Сравнить с английским
o OTM PUTs = Used to hide their SI%. This has no effect on the price ofСравнить с английским
GME because these are not being exercised and they maintain OI even until expiration. The shorters are using these to hide their SI% from the world. The main counter-argument to the MOASS is "their SI% is 20%, they covered". So if you're a shorter and you hide your SI%, you can push that narrative that you covered and hope people sell. Supporting Data: Figure 1, PUT OI Versus SI%. Check out how SI% drops when PUT OI skyrockets.
Сравнить с английским
o ITM PUTs = Used to flash crash the price. This is an expensive move andСравнить с английским
I believe we only saw this happen once, on March 10. This is a last-ditch effort move where you mass exercise ITM PUTs to crash the price down from a critical point. If you don't remember - March 10 the price hit $350 before being flash crashed down. They have purchased up many more ITM PUTs lately, so they might attempt this again. Supporting Data: Figure 2, PUT OI For Options, March 9 to March 11. Look at how the PUT OI dropped on March 10, indicating mass exercise of options to flash crash.
Сравнить с английским
o OTM CALLs = Used by other large players who want a profit. We only Сравнить с английским
just recently started seeing these from what I can tell. I'm assuming that because these just started popping up that other big players are looking to make some cash. The ones that were purchased expire on July 16, 2021. They might be hoping for the squeeze before then and maybe thought $140 was the bottom.
Сравнить с английским
o ITM CALLs = Used by shorters to filter synthetic shares through and Сравнить с английским
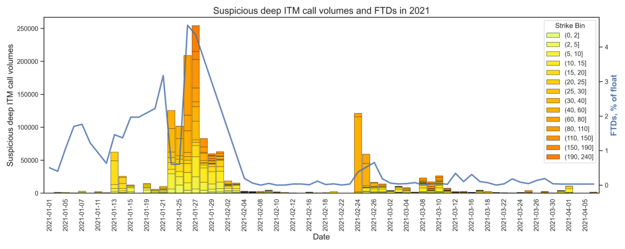
satisfy FTDs. These purchases occur a lot when FTDs pile up. I believe that they continue to use this in conjunction with Citadel in order to fulfil FTDs because there is no liquidity. These options have an effect on price because they are immediately exercised so that the shares can be delivered. Supporting Data: Figure 3, ITM Call Volumes Versus FTDs. Deep ITM CALL volume skyrockets when FTDs increase.
Сравнить с английским
• And my most important finding: shorts r fuk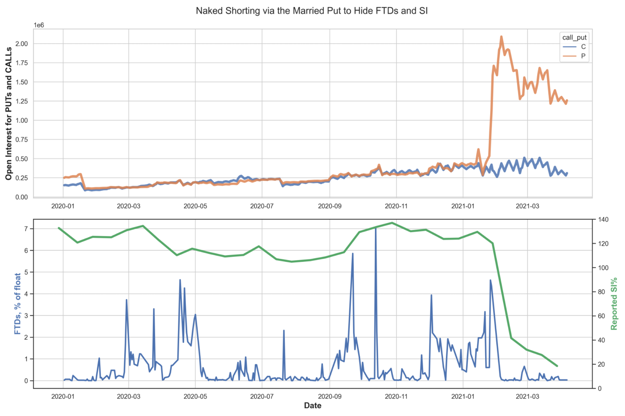
Сравнить с английским
Figure 1: PUT OI Versus SI%

Сравнить с английским
Figure 2: PUT OI For Options, March 9 to March 11
Сравнить с английским
Figure 3: ITM Call Volumes Versus FTDs
Сравнить с английским
1. There Are No Shares Left. Every Share Being Bought Is Synthetic
Сравнить с английским
Well, at least most of them are synthetic. A vast majority are synthetic due to SI% being over 100% since December. You don't just suddenly find liquidity in GameStop after naked shorting the shit out of it. It's going to have to be continuously naked shorted (and produce synthetics) to satisfy buyers until the MOASS. Otherwise, whoopsie. They'll have to start unwinding a bunch of FTDs from being forced to deliver (and find the shares). So instead of that route, they'll make fake shares for the FTDs. I've been trying to understand what the hell has been going on with the price. Why did it surge in January? Why did it surge in February? Why March? Why did we see volatile jumps all over the place? Why does buying pressure seemingly get negated? T+13? T+21? T+35? No, no, no. It is all SI Report Loop. They're stuck in that loop and can't get out. I've talked about this in my other DD but I'll recap because it's very relevant here for why we can use ITM CALLs to calculate SI%: The shorters are stuck in a loop revolving around Fina Short Interest Reporting. What exactly is this? FINRA requires firms to report short interest positions in all customer and proprietary accounts in all equity securities twice a month. There's three columns on that link. What are they:
Сравнить с английским
• Settlement Date: The date at which short interest positions must be determined.Сравнить с английским
• Due Date: The date at which the report of the SI from the settlement date is due by.Сравнить с английским
• Exchange Receipt Date: The date when FINRA finalizes the reports and delivers them.Сравнить с английским
You want to make sure that your short positions are hidden by the Settlement Date so that it pops up to the world on the Receipt Date. For example, they opened up a shitload of OTM PUTs (Figure 1, PUT OI Versus SI%) prior to January 29th Settlement. Upon February 9th, SI% dropped like a rock. As long as short positions are hidden or covered by the Settlement date, then the receipt date will not take those into account. Refer to Figure 1 on PUT OI skyrocketing when SI% dropped. At that point in time (early February), they could claim to the world that they covered, and they did claim that, but they actually just hid their short position from the world's eyes. Here's a copy/paste of the dates for 2021. I'm going to only copy the ones through the start of June:
Сравнить с английским
Settlement Date Due Date Exchange Receipt Date Сравнить с английским
January 15 January 20 January 27Сравнить с английским
January 29 February 2 February 9Сравнить с английским
February 12 February 17 February 24Сравнить с английским
February 26 March 2 March 9Сравнить с английским
March 15 March 17 March 24Сравнить с английским
March 31 April 5 April 12Сравнить с английским
Settlement Date Due Date Exchange Receipt Date Сравнить с английским
April 15 April 19 April 26Сравнить с английским
April 30 May 4 May 11Сравнить с английским
May 14 May 18 May 25Сравнить с английским
May 28 June 2 June 9Сравнить с английским
June 15 June 17 June 24Сравнить с английским
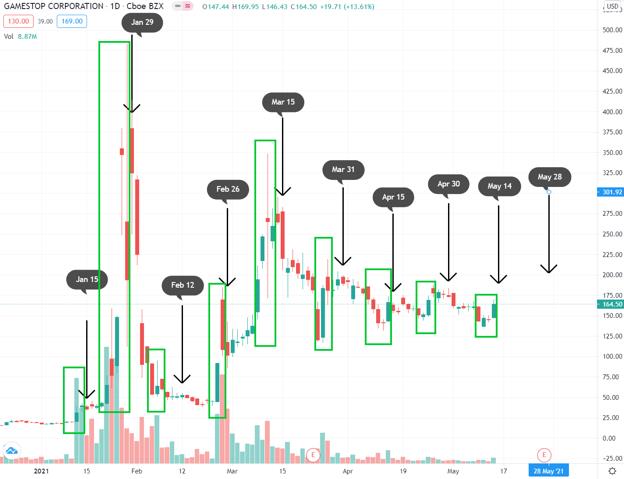
So we can say that between each Settlement Date is a loop where they'll have new shorts open up, and then they want to hide those new shorts by the next Settlement Date so that it doesn't appear on the SI% report and increase it. (Imagine if one day we saw SI% jump back up from 20% to 140% or more. Imagine the headlines. They can't risk that happening). And what exactly goes on between each loop? Let me bring up my handy-dandy chart again before continuing. I've plotted the Settlement Dates here and boxed volatility moments. You'll see that there is ALWAYS a volatile move up and a volatile move down between these dates.
Сравнить с английским
Figure 4: SI Report Loop And Volatility
Сравнить с английским
Here's what I am assuming happens: 1. Retail starts buying. They (Citadel & Co) create synthetics to match this buy pressure because there's no liquidity/no shares available. This negates buy pressure and any additional shorts (iborrowdesk) helps drive the price downward. 2. Retail doesn't get their shares delivered. FTDs start piling up. The synthetics created in #1 and the shorts that were opened in #1 need to be hidden by the next SI report date otherwise it will pump the SI% up again. The FTDs must be satisfied as well or it will start an unwinding of their massive web of bullshit. 3. They feed these synthetics into Deep ITM CALLs that are then purchased up, exercised, and used to satisfy the FTDs that were created by retail buying. This process drives the price up. Retail now owns more fake shares and their overall short position continues to grow. 4. Combination of #1 and #3 cancels out the downward pressure on the price. GME creates a higher low as long as retail didn't sell. If you look at the GME price chart, you'll notice how it continues to create a higher floor between each SI Report Cycle. Basically, the "true" GME price is revealed after #1 and #3 cancel each other out because it shows how retail buying increased the price relative to the prior SI Report Cycle. 5. Any additional shorts they have will be pushed under the rug with OTM PUTs. Each cycle they continuously grow an ever larger short position and thus an ever larger SI% with these synthetics and additional borrowing. Meaning they continue to have higher risk, and their margin call
Сравнить с английским
price slowly moves downward. They keep making it worse for themselves. Every cycle they spend a little money kicking it down the road. Every cycle the price floor rises. Every cycle they increase their short position. You know how we see >=50% short volume each day? That's most likely them pairing 1:1 with retail buys for synthetics so that they can be later delivered through ITM CALLs. A bold assumption of course, but it could be relevant and might explain why we've been seeing that data of short volume. That's why I believe that the volatile price movements both up AND down are caused by the shorters themselves by holding back buy pressure and then unleashing it at a later date. They are the reason we see bursts of high volume and large surges on certain days. They suppress the buy pressure with synthetics, but then must deliver those synthetics to satisfy FTDs. Upon exercising the ITM CALLs to deliver these synthetics, they cause the price to surge upward. I am assuming that every one of these Deep ITM CALL purchases are synthetic-covered and thus 100 fake shares per contract.
Сравнить с английским
2. Assumptions In Calculating SI%, And Results
Сравнить с английским
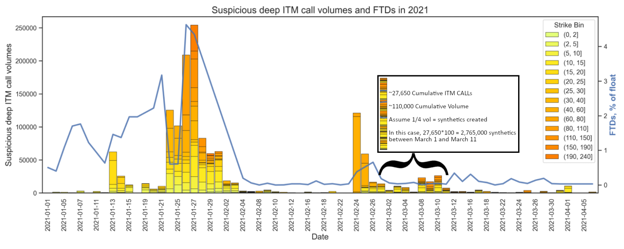
We're assuming that the Deep ITM CALLs are not used to hide FTDs but they are rather used to satisfy the FTDs immediately with fake shares. This is most likely why we never saw the "hidden FTDs" pop out again to support the FTD squeeze theory. Because they've already been delivered, and the synthetics keep pumping into their total SI%. So they're in the process of juggling an ever-increasing SI% position while the price also continues to rise. Per /u/Dan_Bren, between March 1st and March 11th, inclusive, there were approximately 27,650 Deep ITM CALLs purchased. If we assume that all of those were to fulfill FTDs and are synthetic due to no liquidity in the market, then that comes out to 27,650 * 100 = 2,765,000 synthetic shares from March 1st to March 11th. In another post, on April 1st, there were approximately 5,960 Deep ITM CALLs purchased. Likewise, this equates to 5,960 * 100 = 596,000 synthetic shares on April 1st.
Сравнить с английским
Figure 5: Cumulative Deep ITM CALL Volumes, March 1st to March 11th
Сравнить с английским
Look at the volumes between March 1st and March 11th compared to everything else. Oof. All those blips of ITM CALL anomalies is nothing compared to January and the spike in February. To be conservative I'm going to ignore straight up "volume" and rather calculate SI% based on a ratio of /u/Dan_Bren's data to the volumes we see. Here's results based on March 1st to March 11th, and April 1. I'm going to do an even value closer to the lower bound of 0.25 to get our "Average". It just makes the math easier.
Сравнить с английским
March 1st to March 11th April 1 Сравнить с английским
Cumulative ITM Calls 27,650 5,960Сравнить с английским
Cumulative Volume ~110,000 ~14,000Сравнить с английским
Ratio of Volume to CALLs ~0.25 ~0.42Сравнить с английским
"Average" Ratio ~0.3Сравнить с английским
Since we don't have historical data prior to 3/1, I'm going to use these two data points (March 1-March 11, and April 1) as our estimated "synthetics created" per volume. With a conservative estimate, we'll say that we get 30 synthetic-covered CALLs that are exercised for every 100 volume (0.3 ratio). And thus 3,000 synthetic shares per 100 volume. Let's tally it up based on Figure 5. I'm doing approximations for volumes because I do not have the data sheet that was used to create this figure. It's also easier to work with even numbers. Sorry for the long table.
Сравнить с английским
Approximate Synthetic Approximate Synthetic Сравнить с английским
Date Volume CALLs (Volume*0.3) Shares (CALLs*100) Сравнить с английским
Janaury 7 3,125 938 93,800Сравнить с английским
January 11 3,125 938 93,800Сравнить с английским
January 13 62,500 18,750 1,875,000Сравнить с английским
January 14 25,000 7,500 750,000Сравнить с английским
January 15 12,500 3,750 375,000Сравнить с английским
January 19 13,000 3,900 390,000Сравнить с английским
January 20 6,250 1,875 187,500Сравнить с английским
January 21 10,000 3,000 300,000Сравнить с английским
January 24 125,000 37,500 3,750,000Сравнить с английским
January 25 100,000 30,000 3,000,000Сравнить с английским
January 26 210,000 63,000 6,300,000Сравнить с английским
January 27 260,000 78,000 7,800,000Сравнить с английским
January 28 80,000 24,000 2,400,000Сравнить с английским
January 29 61,500 18,450 1,845,000Сравнить с английским
February
Сравнить с английским
1 62,500 18,750 1,875,000Сравнить с английским
February
Сравнить с английским
2 18,750 5,625 562,500Сравнить с английским
February
Сравнить с английским
3 13,000 3,900 390,000Сравнить с английским
February
Сравнить с английским
4 3,125 938 93,800Сравнить с английским
February
Сравнить с английским
5 3,125 938 93,800Сравнить с английским
February
Сравнить с английским
8 3,125 938 93,800Сравнить с английским
February
Сравнить с английским
9 6,000 1,800 180,000Сравнить с английским
February
Сравнить с английским
10 3,125 938 93,800Сравнить с английским
February
Сравнить с английским
11 1,000 300 30,000Сравнить с английским
Approximate Synthetic Approximate Synthetic Сравнить с английским
Date Volume CALLs (Volume*0.3) Shares (CALLs*100) Сравнить с английским
February
Сравнить с английским
16 1,000 300 30,000Сравнить с английским
February
Сравнить с английским
19 3,125 938 93,800Сравнить с английским
February
Сравнить с английским
24 120,000 36,000 3,600,000Сравнить с английским
February
Сравнить с английским
25 60,000 18,000 1,800,000Сравнить с английским
February
Сравнить с английским
26 14,000 4,200 420,000Сравнить с английским
March 1 13,000 3,900 390,000Сравнить с английским
March 2 4,000 1,200 120,000Сравнить с английским
March 3 10,000 3,000 300,000Сравнить с английским
March 4 8,000 2,400 240,000Сравнить с английским
March 8 24,000 7,200 720,000Сравнить с английским
March 9 15,000 4,500 450,000Сравнить с английским
March 10 26,000 7,800 780,000Сравнить с английским
March 11 6,500 1,950 195,000Сравнить с английским
March 12 2,000 600 60,000Сравнить с английским
March 15 2,000 600 60,000Сравнить с английским
March 17 6,000 1,800 180,000Сравнить с английским
March 18 3,125 938 93,800Сравнить с английским
March 25 3,125 938 93,800Сравнить с английским
March 29 3,125 938 93,800Сравнить с английским
March 31 4,000 1,200 120,000Сравнить с английским
April 1 10,000 3,000 300,000Сравнить с английским
Total 42,713,000Сравнить с английским
Yup. Assuming only 30% of the volumes resulted in actual synthetic CALLs being exercised to cover FTDs, we come up with a potential of 42,713,000 synthetic shares being created between January 7th and April 1st. Just for fun though, and I'm sure some of you are curious. Let's assume 100% of the volumes were accounted for. What would that give us? Dun dun dun... 142,375,000 synthetic shares. But I'll stick with the conservative estimate for now. Just thought I'd slap that in there for fun. Now let's assume that these were all NEW synthetics created because the SI was already over 100%. (Why else would they be buying these? The assumption is ITM CALLs are necessary for zero liquidity.) So we'll take the peak SI% since shitheads never covered and never will cover. The SI was 141% at its peak. Since 141% is based on 55,000,000 float, we'll say the original short position was 77,550,000, resulting in a grand total of 120,263,000 shares short as of April 1. What is the theoretical SI% now with our estimated shorts/synthetics just up to April 1st if the GME float is either 55,000,000 or the theoretical 30,000,000 as of late?
Сравнить с английским
GME Total Float SI% Сравнить с английским
55,000,000 218%Сравнить с английским
30,000,000 400%Сравнить с английским
Oh dear god. That's a lot of tendies. They're amassing such a huge position that keeps growing every single SI Report Cycle. It's no surprise these reverse repo rates are coming out more frequently and in larger sums. They are battling a massive risk position now and GME is continuing to rise in price. They've got to be on their last legs. GME has been edged so much and so long that when it explodes it's going to rip a hole in the fabric of space and time and the simulation we live in will crash. Cheers apes. I'll see you on the other side.