영문과 비교하기
영문과 비교하기
0. Preface
영문과 비교하기
Welcome. WELCOME. More patterns. More dates (T+21 dates). I'm not a financial advisor - I don't provide financial advice. Also, you must be pretty nuts to be listening to a Pomeranian. I made a post before about the price entering the DANGER ZONE and thought it was above $160. Well,
영문과 비교하기
let's revisit that topic because of the interesting price movement we have been getting.
영문과 비교하기
Somebody. PLEASE call Kenny. Marge? You there?
영문과 비교하기
TLDR: Danger Zone part 2
영문과 비교하기
• The price floor continues to rise each T+21 cycle.영문과 비교하기
• Price goes on a Crabby Move 🦀on normal T+21 dates - floor rises about $30 each 영문과 비교하기
time.
영문과 비교하기
• Price goes on a Parabolic Move 🚀between T+21 dates where major options come 영문과 비교하기
into play (January 15, April 16, July 16) - floor rises about $80 each time.
영문과 비교하기
• If the price pattern continues, we should see a $500 floor by January 2022.영문과 비교하기
• Shorts haven't covered. They post unrealized losses and unrealized gains to mess 영문과 비교하기
with you.
영문과 비교하기
• Retail average base cost is (probably) around $156.57. This is most likely the 영문과 비교하기
shorter average short price.
영문과 비교하기
• Shorts with an average price of $156.57 would experience 100% loss around 영문과 비교하기
$313.14. (Speculative based on data - the real cost could be around $350).
영문과 비교하기
• Shorters are terrified of $300+, there's been a big battle here for a few days, 영문과 비교하기
hinting that small short positions are about to hit margin call territory (the Danger Zone).
영문과 비교하기
• The current price momentum in this gamma is much stronger than the previous 영문과 비교하기
two gammas of January and March. They're trying desperately to not let it take off.
영문과 비교하기
• The moment one shorter falls, the dominos fall.영문과 비교하기
• I like the stock. I also like you. 😉영문과 비교하기
1. Ever-Rising Price Floor And Projection For The Next Few Cycles
영문과 비교하기
I've been getting pinged a lot on the next T+21 dates and when the next possible parabolic move could be coming. You might say "Past performance is no guarantee of future results" and generally I would agree. But with T+21 consistently occurring and the parabolic moves so far looking like they were triggered by major option dates, I'd say it's a pretty good bet that past performance will guarantee future results.
영문과 비교하기
• Every 21 trading days a price spike occurs. Upon each spike, the clock resets to 0, and영문과 비교하기
you count up 21 trading days following. Note that you must ignore holidays.
영문과 비교하기
• Major options dates appear to drive parabolic moves upward. "Major dates" are the only영문과 비교하기
option dates which were available early last year for the 2021 trading year.
영문과 비교하기
o January 15 --> February 24 - March 10; Parabolic Move영문과 비교하기
o April 16 --> May 25 - June 9; Parabolic Move (Maybe more movement to영문과 비교하기
come)
영문과 비교하기
o July 16 --> August 24 - September 8; Parabolic Move (Projected)영문과 비교하기
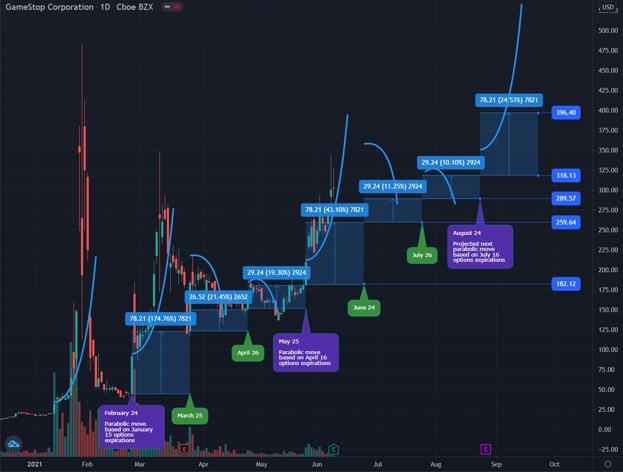
I will say, the only thing that could make this crap the bed is if DTC-2021-009 somehow affects T+21. Guess we'll have to see what happens on June 24th, the next T+21. I'm thinking it does not, since T+21 is most likely not caused by a DTC rule, and therefore the DTC can't mess with that timeframe. On another note, there is speculation that T+21 is not actually a thing. It could be due to other mechanics we don't fully understand (T+35 rule or Net Capital for example). That being said, we're consistently in this loop so far. So, for the sake of making it easy to understand the loop, I think it's safe to continue calling it T+21. Without further ado, here you go! Projection of price movements with T+21 dates labeled for the next few months.
영문과 비교하기
Price Projection Based On Rising Floor Every T+21 Days And Major Option Expirations
영문과 비교하기
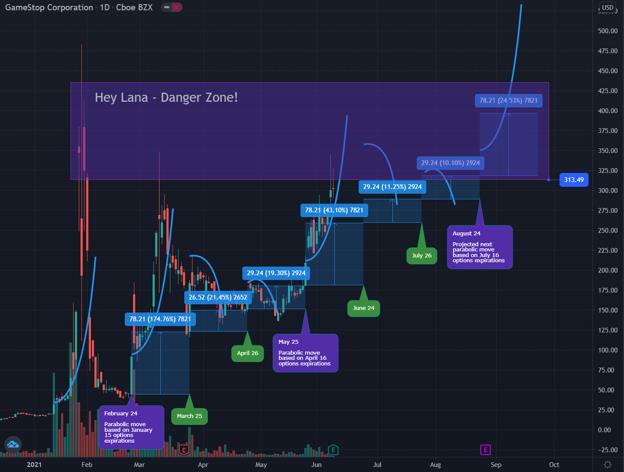
It's a bit of a wild chart, so I'm sorry if it's cluttered. I've plotted with curvy lines the parabolic momentum that we see, and the crabby moves we get dependent on the different factors at play that cycle: 1. February 24 -> March 25: Parabolic Move 🚀 (January 15 options) 2. March 25 -> April 26: Crabby Move 🦀 3. April 26 -> May 25: Crabby Move 🦀 4. May 25 -> June 24: Parabolic Move 🚀 (April 16 options) 5. June 24 -> July 26: Crabby Move 🦀 6. July 26 -> August 24: Crabby Move 🦀 7. August 24 -> September 8: Parabolic Move 🚀 (July 16 options) In the chart, there's blue boxes starting at the floor of the previous cycle and ending at the floor of the next cycle. I drew them very roughly, so the numbers on the graph aren't exact. Sorry. I'm moving a bit quick. You'll see that the floor has continued to rise. Although I'm sure many have already seen that from the exponential floor posts! This is expanding on those posts and is a visualization to show that the floor rises every T+21 day cycle. So far, it looks like it rises at a very nice rate, even with the crabby cycles:
영문과 비교하기
• Crabby Moves 🦀 increase the floor roughly $30 each time.영문과 비교하기
• Parabolic Moves 🚀 increase the floor roughly $80 each time.영문과 비교하기
If the patterns follow, we could see the following price floors. Note that between April 26 and May 25 that the price broke below the previous floor. That's ok and expected. They can short a hell of a lot more shares to try to pull the price down between these cycles, but the floor continues to rise upon each T+21 date, despite this trickery.
영문과 비교하기
Price Floor $ Increase From % Increase From 영문과 비교하기
T+21 Date (Roughly) Previous Previous (Rounded) 영문과 비교하기
February 24 $45 - -영문과 비교하기
March 25 $116 $71 157%영문과 비교하기
April 26 $148 $32 28%영문과 비교하기
May 25 $182 $34 23%영문과 비교하기
June 24 $259 $77 42%영문과 비교하기
July 26
영문과 비교하기
(Projected) $289 $30 12%영문과 비교하기
August 24
영문과 비교하기
(Projected) $318 $29 10%영문과 비교하기
September 8
영문과 비교하기
(Projected) $396 $78 25%영문과 비교하기
After September 8 I don't think we'll see another parabolic move for a while, since that would be due to the last "major option date" of 2021 (July 16 options). The next "major option date" would be for January 2022. But, if the pattern continues, then the price floor would be around $500 by January 2022. Ooftah. Think they could last that long?
영문과 비교하기
2. Short Position "Gains" And "Losses" Are Unrealized. They Averaged Up.
영문과 비교하기
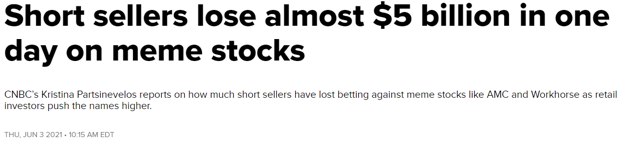
I want to bring your attention to another matter that has popped up a lot, and there's a lot of celebration around it. The articles about short sellers "losing" billions of dollars in short positions on meme stocks. Horray!!! Shorts are bleeding money! Right? I don't think so. They're bleeding, but not for this reason.
영문과 비교하기
https://www.cnbc.com/video/2021/06/03/short-sellers-lose-almost-5-billion-in-one-day-on-meme- stocks.html#:~:text=CNBC's%20Kristina%20Partsinevelos%20reports%20on,investors%20push%20the%20names%20higher.
영문과 비교하기
I've always thought these articles being posted were interesting.... almost as if they wanted to convey that the shorters "covered". (A few small shorters, like new retail shorters, might have covered. But not the big ones). Hint hint. They haven't covered. They do not plan to cover. The margin call Thanos snap when they get liquidated will finally make them cover.

영문과 비교하기
https://www.reddit.com/r/wallstreetbets/comments/lawubt/hey_everyone_its_mark_cuban_jumping_on_to_do_an/
영문과 비교하기
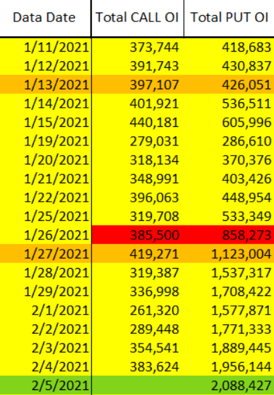
I always look back at the total PUT OI going on an absolute tear in January when they hid SI% and think to myself, "Damn. That's totally not normal." Take a look at this. PUT OI spikes to 2e6 OI = 200m shares worth in PUTs. These PUTs were spread far and wide to many options expiring from February 5 all the way to January 2023. What in the hell? Totally normal hedge move, yup. Totally normal.
영문과 비교하기
CALL and PUT OI Comparison; Data from /u/yelyah2
영문과 비교하기
They're not covering. They're hiding their shorts and trying everything they can to scare you off. So in my eyes these articles are all bull. Especially this one from the start of March:

영문과 비교하기
https://www.cnbc.com/2021/03/03/melvin-capital-posts-return-of-more-than-20percent-in-february-sources-say.html
영문과 비교하기
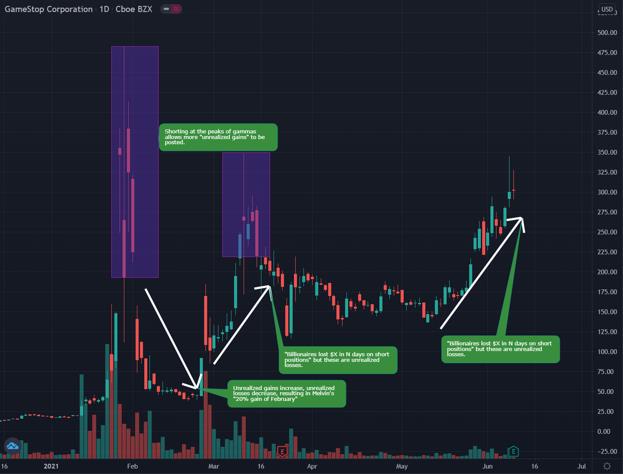
I remember getting pinged about this article and being told that Melvin won, shorters exited, blah blah blah, that was the FUD back then. How could they possibly gain 20% in February after getting obliterated in January? Well... they, and other shorters, must have averaged up their short position price. Anyone who took advantage of the GME peak price in January was able to have a fun time with gains.
영문과 비교하기
Short Position Unrealized Gains / Losses Based On Opening New Shorts
영문과 비교하기
Their overall short position price went up, so they could post that they had returns/gains on that massive downward momentum in February. But these gains are all unrealized. They aren't covering, they're just digging a deeper hole because that's all they can do.
영문과 비교하기
3. Average Retail Buy Price; Average Short Position Price
영문과 비교하기
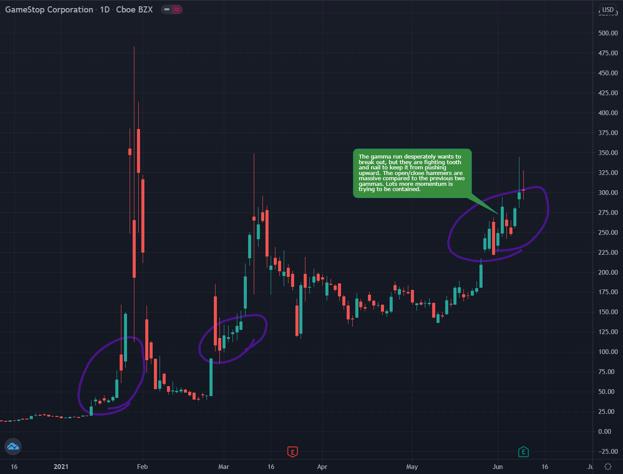
It's an absolute WARZONE right now. The price is so desperately trying to go on a run upward. Last week I was noticing how similar this run was to February, and I was predicting that we'd see another Gamma Neutral spike on June 4th. BUT IT SPIKED UP TWO DAYS EARLIER THAN EXPECTED ON JUNE 2nd. [Data courtesy of /u/yelyah2] That was a big, "Wait. What?" moment for me because it implied this gamma was ready to take off much sooner than the previous gamma run of February 24 - March 10. I should have noticed earlier at how much stronger this run was compared to the previous two gammas. Check out this comparison of the price hammers for January, March, and June gamma runs. Big shout out to /u/sharp717 for identifying the similarities to the January run as well.
영문과 비교하기
Price Momentum Being Contained. January, March, and June Gamma Squeezes
영문과 비교하기
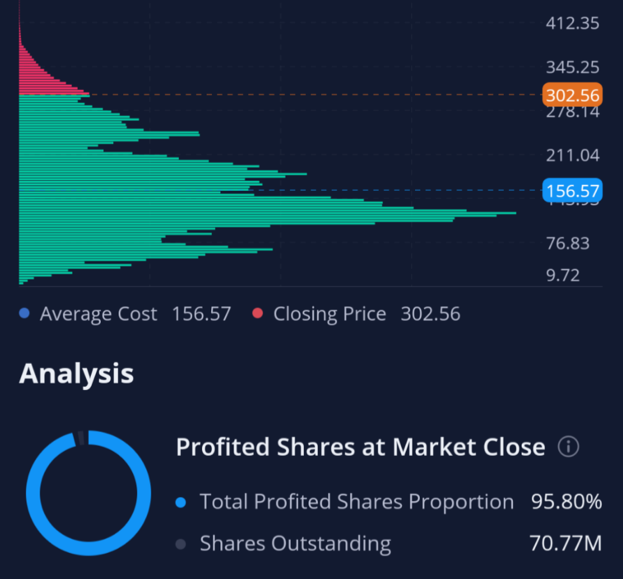
There's huuuuge momentum that they have been trying to contain ever since May 25th. The price has been swinging up and down massively each day in this parabolic cycle🚀. Have they succeeded with suppressing the gamma squeeze? I mean, time will tell. June 9th is when I expected it to either start to go parabolic or be flash crashed down. But it's a goddamn battlefield right now! And this parabolic run is much different and stronger than the previous one. I personally think this run isn't over with. Their attacks are weaker every time, and there's so much strength still in this parabolic cycle🚀. There's so much ammunition being thrown because it truly is getting close to margin call territory, and they're most likely hurting even more in captial from January 15 and April 16 options expiring. Did I say margin call territory? I mean - the DANGER ZONE. Marge, call Kenny. Please. Some big brain apes discussed this Webull chart and the implications of it relating to their "Danger Zone price". It truly is a goldmine. With how popular Webull is it's probably safe to use this as a baseline for retail (and indirectly a baseline for shorters).
영문과 비교하기
Webull GME Statistics. Average share cost of $156.57
영문과 비교하기
What is this telling us? 1. Each horizontal bar represents a cluster of cost basis for retail shares. For example you can see a huge cluster between $76.83 and $156.57. There's way more retail that own shares at that price point than anything above $302.56. 2. The red indicates that the shares owned above $302.56 (price point when this screenshot was captured) currently have unrealized losses. "They're in the red" 3. Likewise, the green indicates that the shares owned below $302.56 currently have unrealized gains. "They're in the green". 4. The blue price point of $156.57 is the average ownership price. Seems fair. We can most likely assume that retail's average base cost is around $156.57. Most retail probably started buying in around December, because that's when the news of a GME short squeeze started to really take off. We can now indirectly say that this is also the average short position price. GME was over 100% shorted in December:
영문과 비교하기
• You have to have naked shorts to get over 100% in the first place.영문과 비교하기
• OBV implies that barely anyone is selling.영문과 비교하기
• This signifies a liquidity issue where synthetics are created, ever-increasing the SI%.영문과 비교하기
• Any retail buy was most likely a new short position that was opened or a swap between영문과 비교하기
paper hands and diamond hands. Our dear shorties might have an average short position of around $156.57. Give or take a little bit. If you have a long position that you opened up at $156.57, and the price goes down to $78.28, you'll be down 50%. If it continues down to $39.14, you'll be down 75%. If you have a short position that you opened up at $156.57, and the price goes up to $234.855, you'll be down 50% on margin. If it continues up to $313.14, you'll be down 100% on margin. BOOM. Marge starts calling. Assumptions per a big brain ape who discussed this: 1. Generally the margin requirements on short positions is 100% cash value of the position a. When you hit 100% loss, marge starts to call. Example of $156.57 short hitting $313.14. You need $156.57 posted to cover your margin requirement. 2. WeBull is a large enough broker to likely be considered a representative sample of all GME holders. 3. This is assuming the positions are unlevered - levering would reduce the margin call point. 4. This is assuming additional capital was not raised against the positions [Such as shill stock tickers pumped and dumped / Crypto / etc].
영문과 비교하기
4. Danger Zone Part 2
영문과 비교하기
They dun goofed. Their FUD attack today (which we expected) was fruitless. All their tricks have been found out lmao. Guess what, Ken? Here's my trick. It's crayons showing the goddamn Danger Zone you're entering and so desperately trying to stay out of. The new and improved danger zone is based on the average short price of $156.57 which would trigger 100% losses at $313.14 assuming 100% margin requirements. [Note: Speculative based on Webull data. This could very well be $350 or higher, but the battle at $300 signals that this is a very rough place for the shorters to be].
영문과 비교하기
Danger Zone Visualization
영문과 비교하기
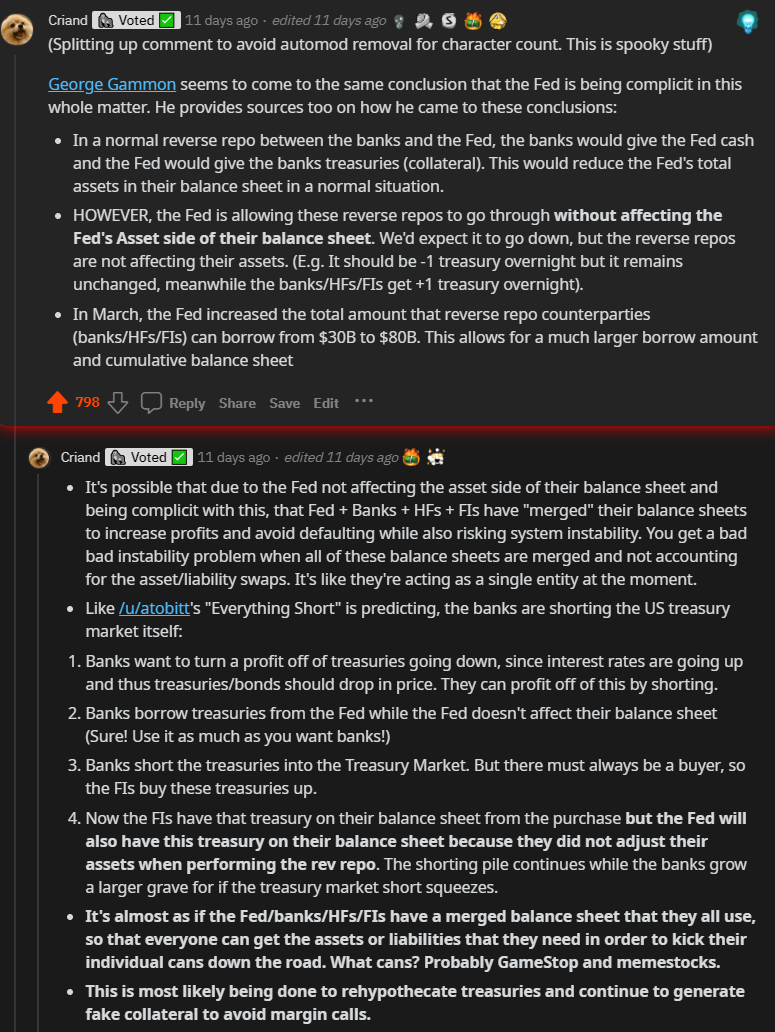
Is this why there's such a huge battle around $300 right now? And why the price is SEVERELY smacked down when it tries to reach above $350? It's probably because this danger zone is when small HedgeFunds / shorters begin to fall, and it's getting so close to closing in the zone. When one of the small shorters fall, it becomes a domino effect. Not only would they initiate buy pressure from covering their short positions, but the banks which are connected to the shorters might get upper-cut just enough to also send the banks defaulting with the ICC. This would then cascade to all the other shorters under that bank because their swaps with the bank for assets/liabilities to pump their balance sheets would get rug-pulled. Not just that... but everyone else on the brink of defaulting in the entire financial world connected to that bank would start to fall. You've all seen the reverse repo market. Things are bad bad BAD in the market. The amount has already reached an all-time high above $500 Billion in a non-quarter end. This is abnormal because quarter- ends are usually the time when banks would take advantage of the repo market to adjust their balance sheets. Other than high levels immediately before a quarter-end, these levels of sustained reverse repo activity in excess of $300 Billion have not been seen since the Great Recession. - Source Everyone in the repo market is terrified of the 2008 bomb that wasn't allowed to finish going off. They're most likely colluding to prop each other up because of the absolute insanity that could follow.
영문과 비교하기
Not just in the stock market. But the repo market, the crypto market, the treasury market, every market potentially.
영문과 비교하기
Possible Collusion In Repo Market
영문과 비교하기
But hey, all it takes is that one. GME has to close just high enough for everything, everything, to come crashing down.