영문과 비교하기
영문과 비교하기
!NEW CHARTS AT THE END OF THE POST - Updated 21.06.2021 01:42 CET! Hey everyone, time is running out for some people in the market and it's neither GME nor retail. A big issue in this whole GME situation is a lack of data. Retails just have access to limited informations, sometimes non, but in generall not enough. I spend the last month learning everything I could about data, what data is available and how to get this free data.
영문과 비교하기
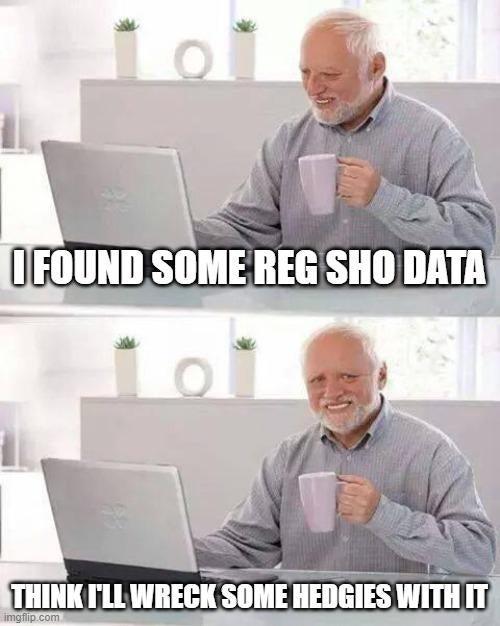
Thx to u/hamzah604 for this great meme! :D
영문과 비교하기
Yeah, RegSho. Everyone knows RegSho. But the data just goes back as far as 1 year and thats it. Really? On the visible level - Yes. On smart brain level - No. I realised that the useable timeframe is moving on with the time passing by. So I asked myself - do they delete the files the moment they disappear on the webside?

영문과 비교하기
So I merged ALOT links in Excel, threw them into JDownloader and VOILA:11.551 Files - and a way more accurate data collection then Apes ever had!
영문과 비교하기
I extracted all available GME data and all available CBOE Data back to 2010, merged them with Historical Data provided by Yahoo, Nasdaq and Fail To Delivery and made on big MasterSheet for every GME retail. The overall accuracy is around 45%. Means, 45% 50,37% (recalculation at the end) of all shares traded between 2010 and 2021 are displayed in the data. Its lower at the beginning of the timeframe, but gets better over time. I already produced some charts for people with the excel-level ape. I further organised my whole data collection, zipped it and uploaded it on Mega so that EVERY FUCKING RETAIL has access to better data for free, totally unrelated to GME. Its a shame that retails are getting no support - so we have to help each other! One chart from the Mastersheet shall be displayed here to raise your attention for data:
영문과 비교하기
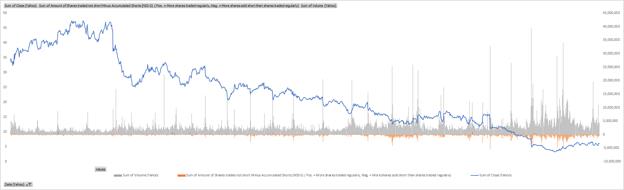
Timeframe 2015-2020 - Does anyone else see a pattern? (Source: Mastersheet)
영문과 비교하기
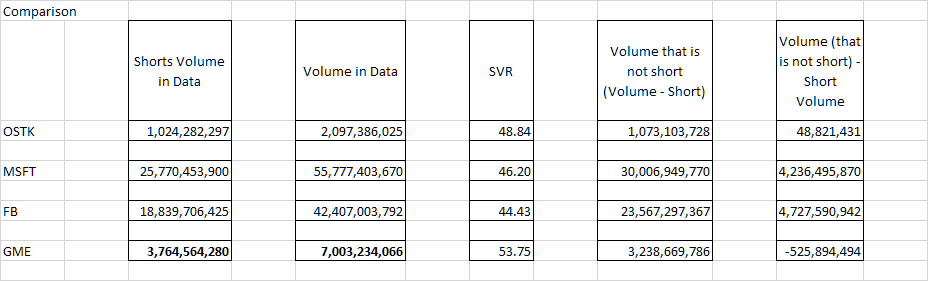
Because my first calculation was like: WTF GME? This doesnt make any sense - Should compare! (thx to the discord dudes giving me this stock names for a comparison). The results are - interesting - And like: WTF?
영문과 비교하기
I dont know if this data set is enough to proof naked short selling with data, but if this is the case, I really would like this SEC Award! :D SEC pls? You can download the Mastersheet here: https://easyupload.io/ogovzr Contains all Information I could find for GME in the data sets. Contains prebuild charts and comparisons.
영문과 비교하기
You can download the whole fkn collection ( 1,4 GB zipped, 4 GB unzipped - 22.734 Files) https://mega.nz/file/ikgUUCRC#HxOl0afMatKWpmmWrYOBMwQgQwVU2MHgGSoG0p1uRQk Contains my entire data collection - have fun! And pls, share it with every community that could have use for this information. The data collection is about ALL stocks - and I think alot retails rely their investment on bad data atm. If you want to work with the raw data on your own, get Notepad ++ - makes it way more easier to work with this amount of data.

영문과 비교하기
To the Moon!!!
영문과 비교하기
Thats the part a youtuber would ask for your financial support, but I have another request:If you make money because of this data collection, you already made a fortune in stocks and you are happy to finally have some quality data - give some money to charity. I worked 4 month to get this done - and you would make me happy if your donation would be for a Children's hospice - because this is something that should be supported more. And I am pretty sure they would love to play some Mario or have a nice stuffed animal of their favorite character. Let's take care of each other and support people who need our help. Let's change the world. Gamers and Retails United! Best wishes and have a great Weekend! Your AnnihilationGod PS: I'll publish the link to the updated versions of the collection and mastersheet on my Twitter:@ Annihil4tionGod or here at r/Superstonk . If you got any questions regarding the data and so on, pls reach out.
영문과 비교하기
Usefull links to get daily data about shorting:http://regsho.finra.org/regsho-June.html https://www.cboe.com/us/equities/market_statistics/short_sale/?mkt=bzx https://www.cboe.com/us/equities/market_statistics/short_sale/?mkt=byx https://www.cboe.com/us/equities/market_statistics/short_sale/?mkt=edga https://www.cboe.com/us/equities/market_statistics/short_sale/?mkt=edgx Historical Data (open, high, low, close, volume:): https://de.finance.yahoo.com/quote/GME/history?p=GME https://www.nasdaq.com/de/market-activity/stocks/gme/historical SEC Search Edgar (better then Sec.report):https://www.sec.gov/edgar/search/?r=el#/dateRange=all&category=form-cat0
영문과 비교하기
Add: I wanna thank SC - he helped me alot over the past months - this collection would not exist without his advice and support whenever I could not solve a problem! Thx SC!;) I owe you a beer!
영문과 비교하기
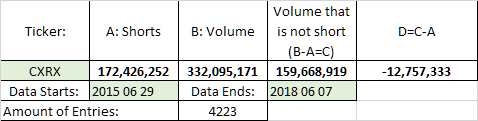
Update 22:50 CET **Add2:**I couldnt accept that i couldnt find any stock so far with a negative quote like GME - so I made another research. I decided to choose the stock mentioned in this article I had read back in Feb 2021: https://www.securitiesfinancetimes.com/securitieslendingnews/industryarticle.php?article_id=22454 8&navigationaction=industrynews&newssection=industry
영문과 비교하기
Perhaps someone who already downloaded the collection could crosscheck this pls?
영문과 비교하기
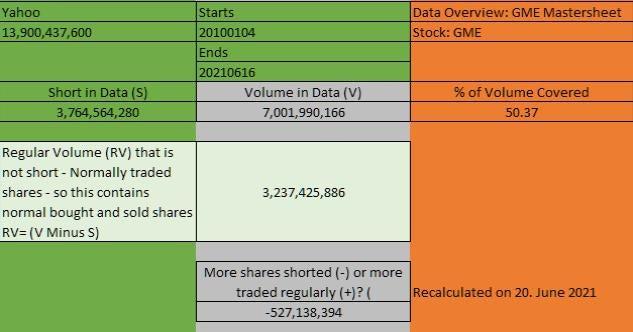
Add3: 20. June 2021:I have to admit that I did a mistake while calculating the accuracy of the data. It is 50.37% instead of 45% like i wrote before.
영문과 비교하기
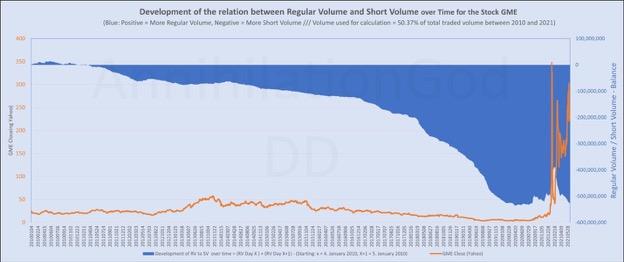
I looked deeper into the data to understand the relationship between regular volume and short volume better. This is the result for the Timeframe 2010-2021. I am trying to increase my data collection tonight and will try to find out, if the balance had been positiv before 2010.
영문과 비교하기
Chart GME
영문과 비교하기
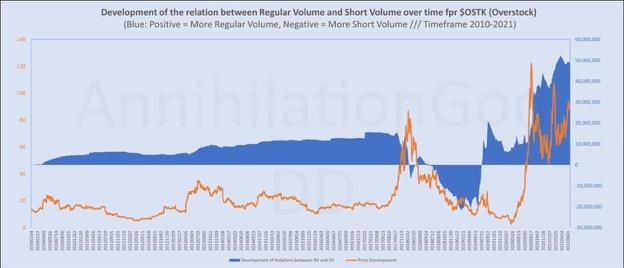
Chart OSTK - I though it would be a good idea to use OSTK again because i already compared it above with GME.