Comparer avec l'anglais
Comparer avec l'anglais
Edit/Update: Thank you for the love and awards!!! I have posted a question about this to Dr. Timbrath’s AMA, here, if anyone else is interested on her opinion of this. Apes, our primate community has gone through a lot in the last 4 months. We’ve been called names, lied to, and manipulated through the same PsyOps techniques typically used on extremist groups. Throughout everything you beautiful people have remained stubborn and hyper-rational while never losing your love of crayons, and I have never been more proud to be an ape. Therefore, before we completely undress GME time and sales data, I would like to dedicate this research to:
Comparer avec l'anglais
Shills. Thank you shills everywhere, for making this research possible.
Comparer avec l'anglais
You’ve made sure I stay good and motivated (pissed off) by harassing my online friends, name-calling good people for no reason, and attacking my computer with malware after every stats-based post I’ve made public. (I may an idiot, but after the third time this happened, I was fairly sure it wasn’t random bad luck.) Thanks for the 100s of subscriptions to random-ass pron sites, much appreciated. You’ve also provided LITERALLY the best peer-review system I’ve ever experienced. Never has someone caught my tiny mistakes SO quickly- your hard work and diligence has enabled me to very quickly correct and refine my research, drastically improving the quality of the final product. THANKS. NOW, time to strip time and sales data down to nothing but binary code and statistics. All methods, raw datasets, and completed analyses can be found here: Materials, Methods, and Madness. Briefly: I have created a spreadsheet analysis that runs on only one source of data, time and sales, exported from Fidelity Active Trader Pro. The spreadsheet reports whether each trade had a POSITIVE or NEGATIVE effect on the price, and thus designates the trade a “BUY” or a “SELL.” Many trades have no effect on the price: these shares have been included in the total counts but not towards any buy or sell total. This is an imperfect method to calculating total buy and sell volume, but as you will see, correlates well to overall price movement of the stock and therefore provides a statistically significant buy:sell ratio that we
Comparer avec l'anglais
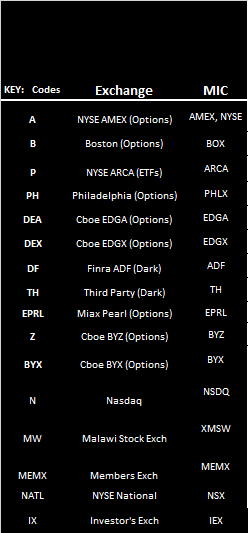
can use. The opening and closing prices are summed, and if the overall price movement does not match the net buy/sell pressure, the spreadsheed tells you IN REALLY BIG LETTERS. The spreadsheet also flags trades priced outside the bid-ask range, with a special check for prices that are crazy high (to catch odd price spikes as I did in my first rant with statistics here). I also have it check for “odd lots“ from options-based exchanges- if a trade comes from a bid or ask exchange that specializes in options only, it should really be 100 shares traded or a multiple (1 options contract = 100 shares). I’ve relaxed the tolerance a bit, and the check is only for things that are non-divisible by 10 originating from an options-based trade.
Comparer avec l'anglais
fidelity loves acronyms
Comparer avec l'anglais
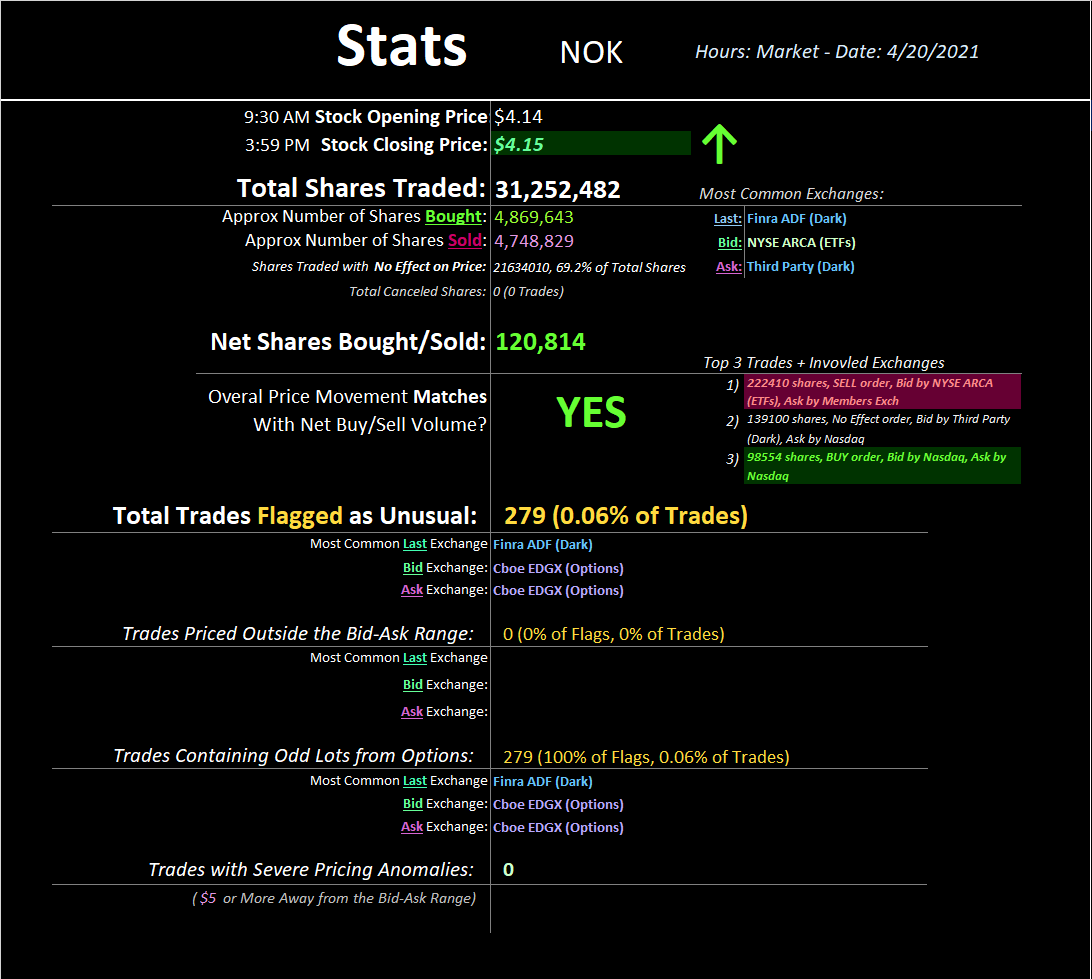
First, let me show you some “controls;” aka super “boring” stocks that we are assuming are NOTmanipulated and therefore do NOT have artificial price movement: their price movement is natural and expected based on buy and sell volumes. And the most boring stock prize goes to....
Comparer avec l'anglais
Nokia of course!!
Comparer avec l'anglais
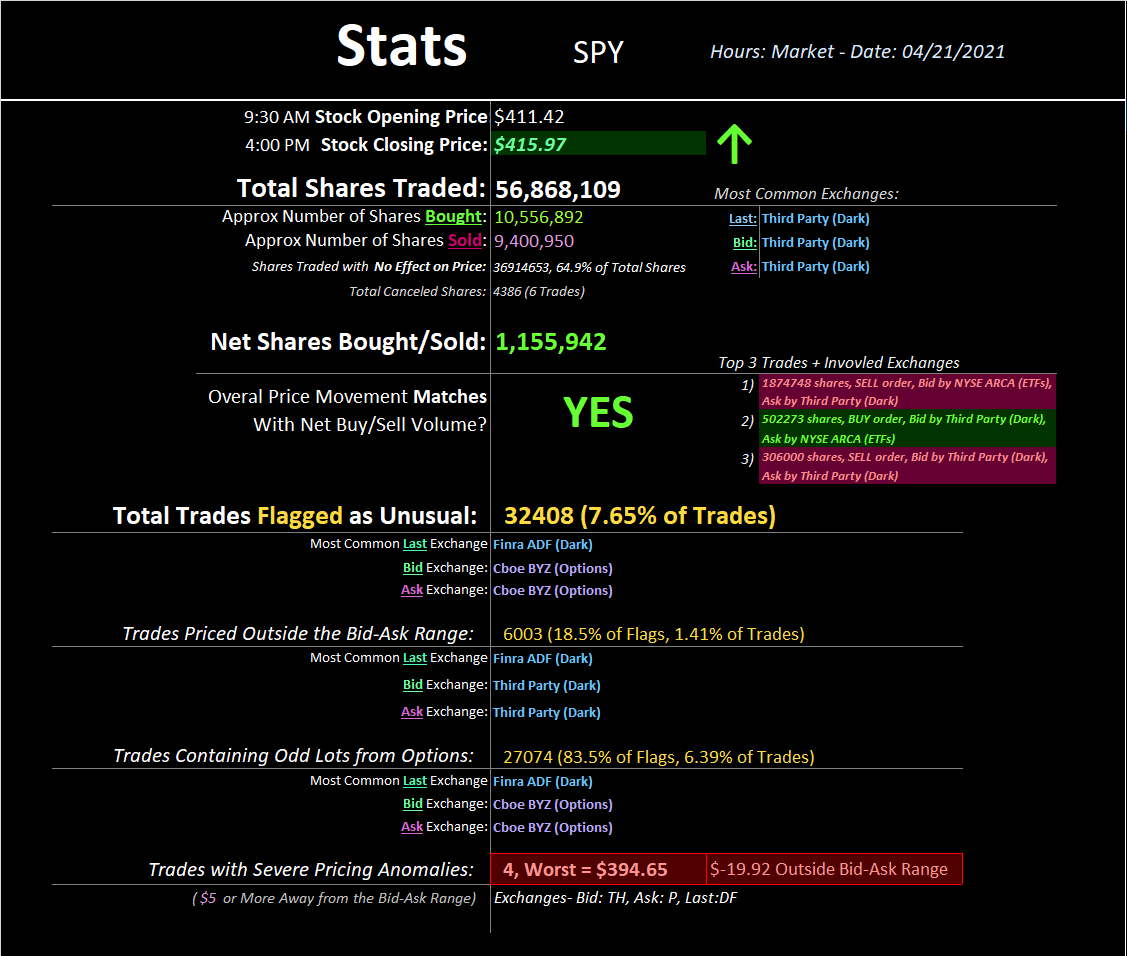
This is the “summary sheet” that gets printed with all the nifty info. This is what “normal” looks like- more buy volume than sell volume detected matches with the closing price going up. Pathetically small number of trades were flagged as unusual, all having to do with odd lots being traded by options exchanges. Looks good. Next control, the SPY-
Comparer avec l'anglais
wait what
Comparer avec l'anglais
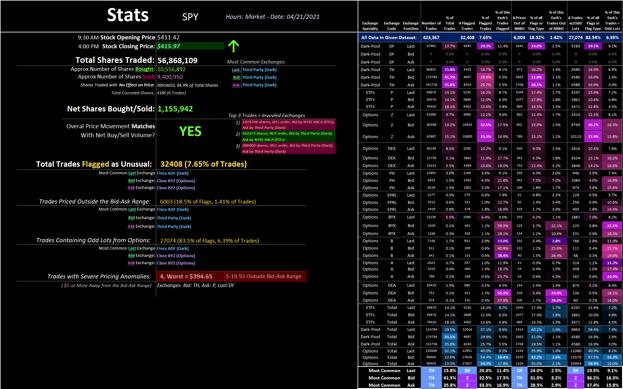
Everything looks great, happy spreadsheet, except for four really weird trades I totally did not expect to find. Here's the full mind-fuck analysis on this data:
Comparer avec l'anglais
color-coded fuckery!
Comparer avec l'anglais
The "main offenders" are listed at the bottom- Options and dark pools. This is my surprised face. Let's look at those crazy prices up close:

Comparer avec l'anglais
some ETF action

Comparer avec l'anglais
dark pools and options

Comparer avec l'anglais
dark pool party

Comparer avec l'anglais
Can I please have shares for $20 under the going price?? I said please.
Comparer avec l'anglais
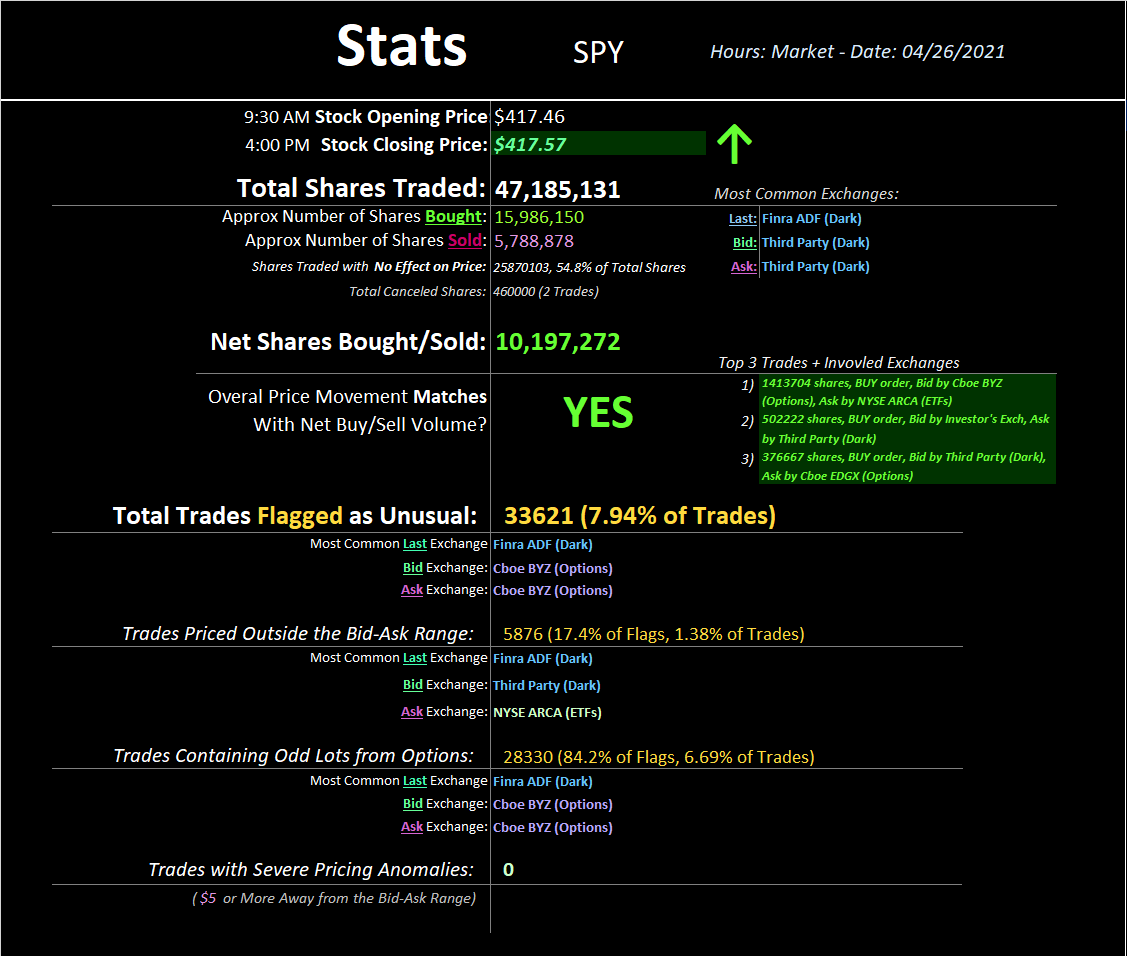
Except for those crazy trades, pretty normal. Here's another SPY, this time from 4/26:
Comparer avec l'anglais
happy spreadsheet!
Comparer avec l'anglais
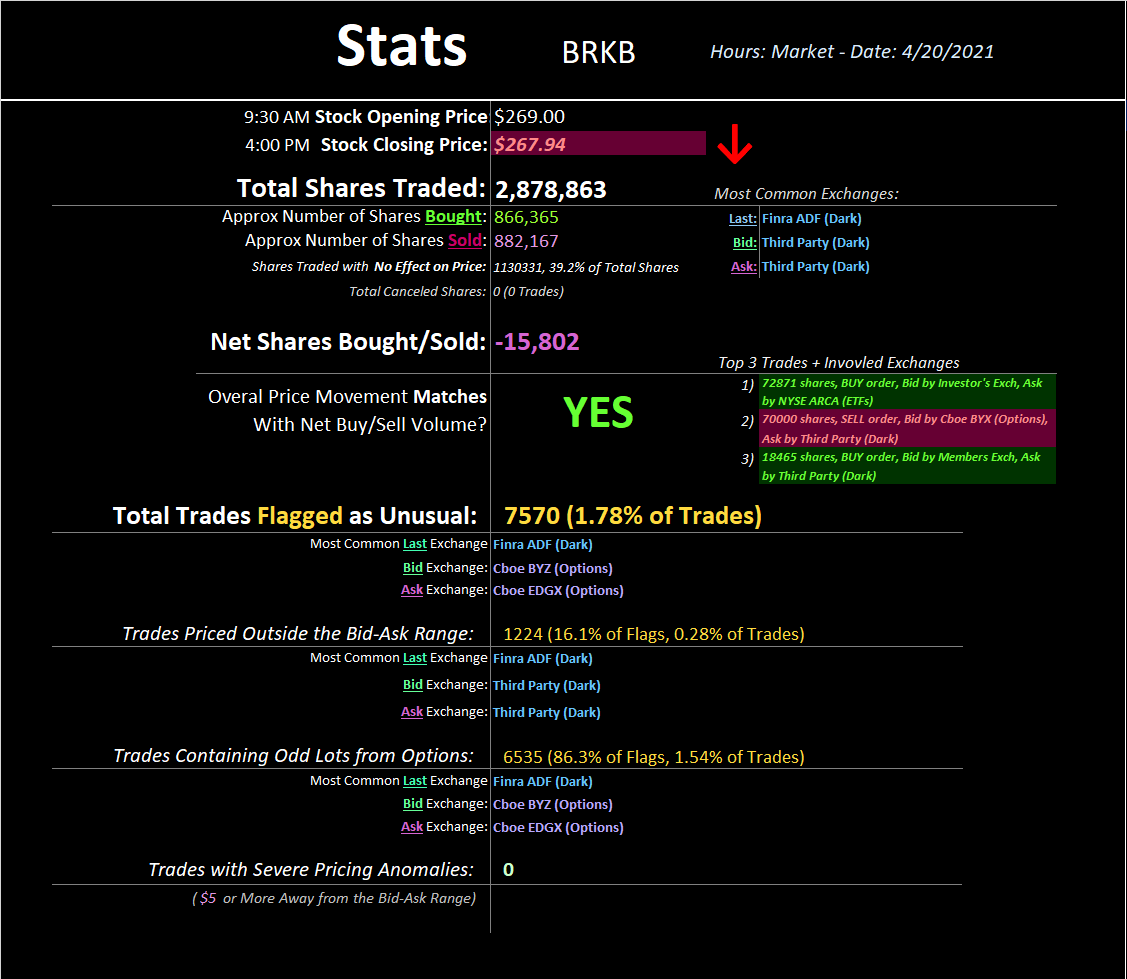
No wacky trades on this day for the SPY. How about one more control analysis:
Comparer avec l'anglais
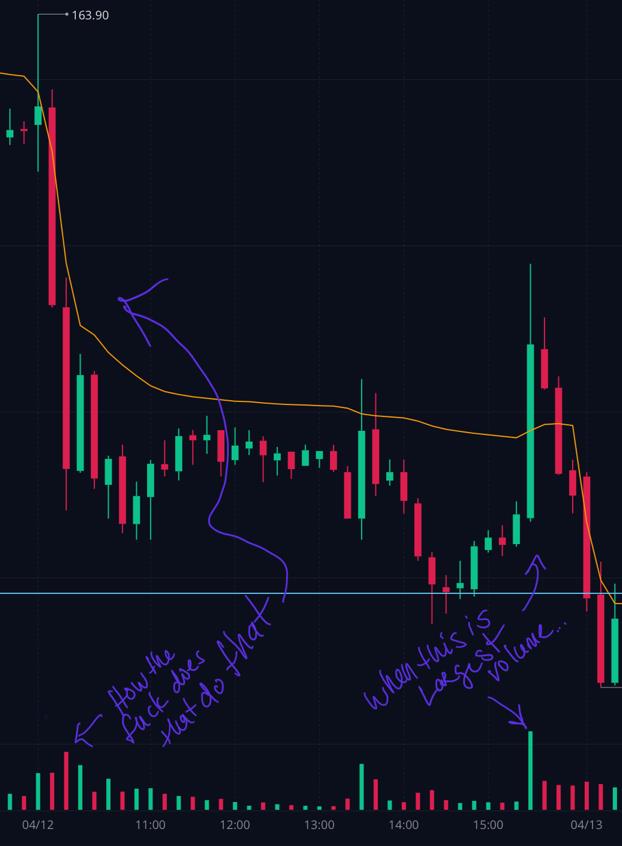
Overall, more shares detected were sold than bought, and the price for the day went down. Lovely! Now, on to the main event. Let's plug and chug some GME! We start with 4/12. Why? Because I was pissed that day.
Comparer avec l'anglais
I ate a lot of crayons later that night
Comparer avec l'anglais
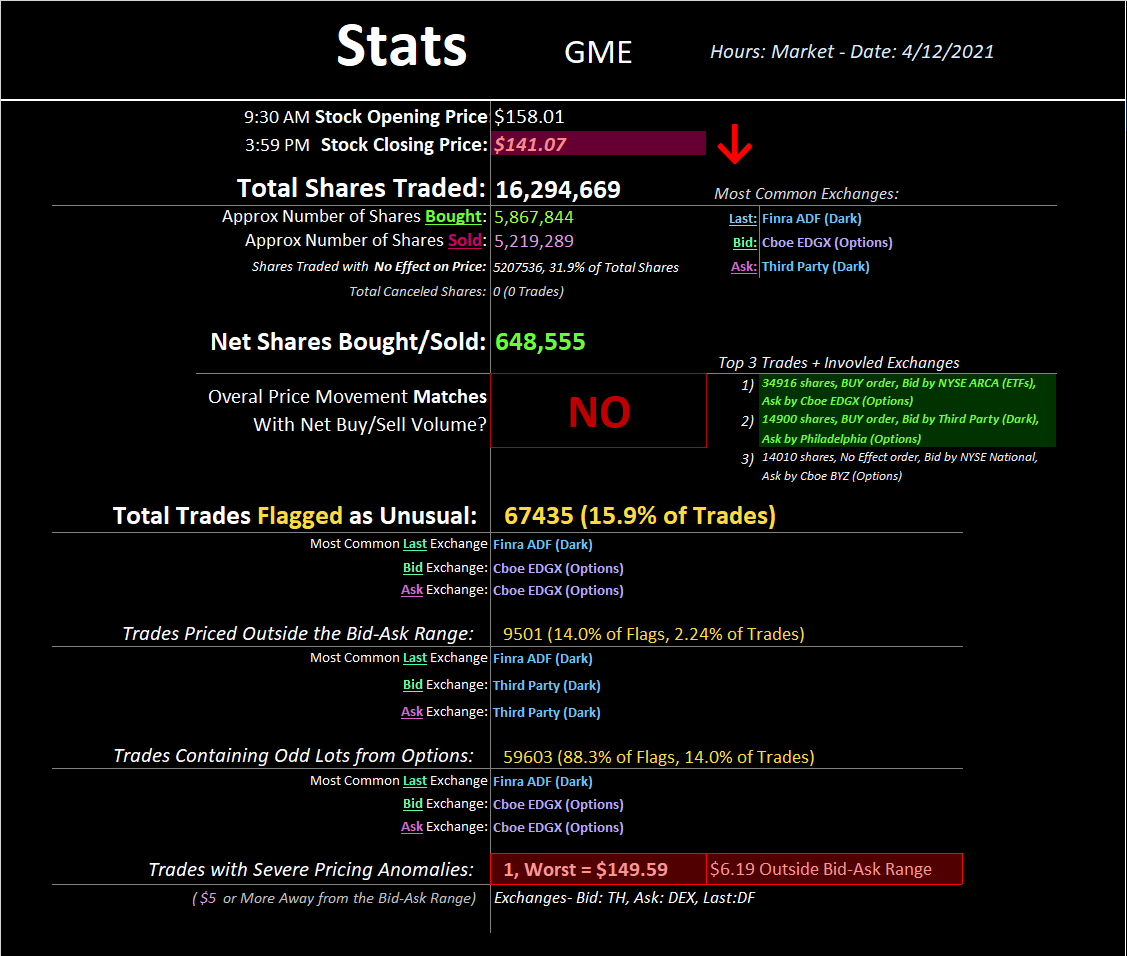
So I was very interested in looking at this dataset. Lo and behold....
Comparer avec l'anglais
more surprise face
Comparer avec l'anglais
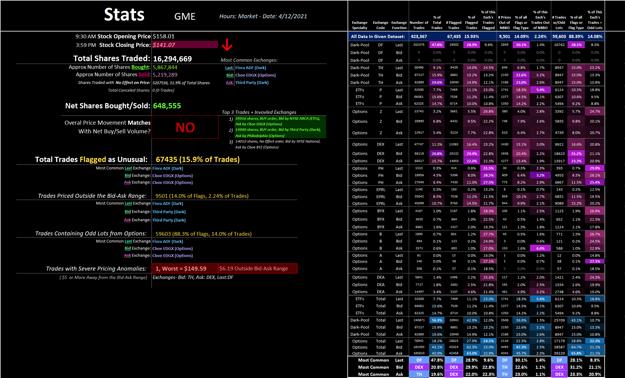
My beautiful spreadsheet telling me exactly what my eyes saw that day. There were more shares bought than sold, yet somehow the price drops $17. Queue mind-fuck:
Comparer avec l'anglais
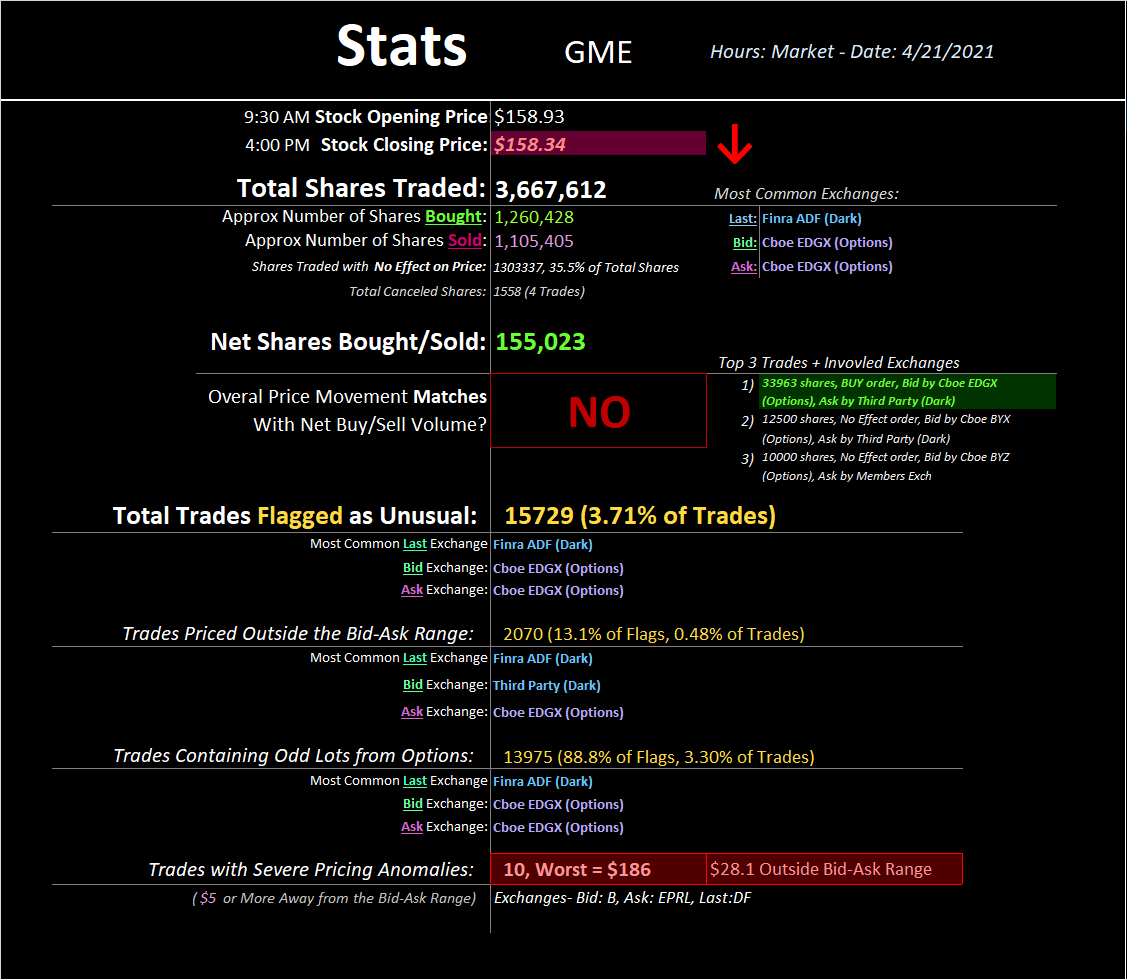
EDGX and dark pool buddies. But of course. These high numbers make me giggle, which offsets some of the freshly pissed-off I am at this concentrated fuckery. I know your brains are tender, but how about one last GME analysis- 4/21 because dyslexia:
Comparer avec l'anglais
omfg?
Comparer avec l'anglais
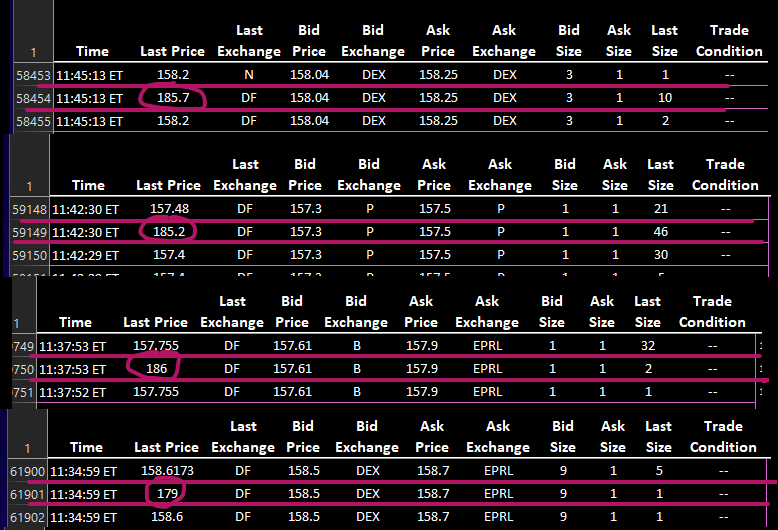
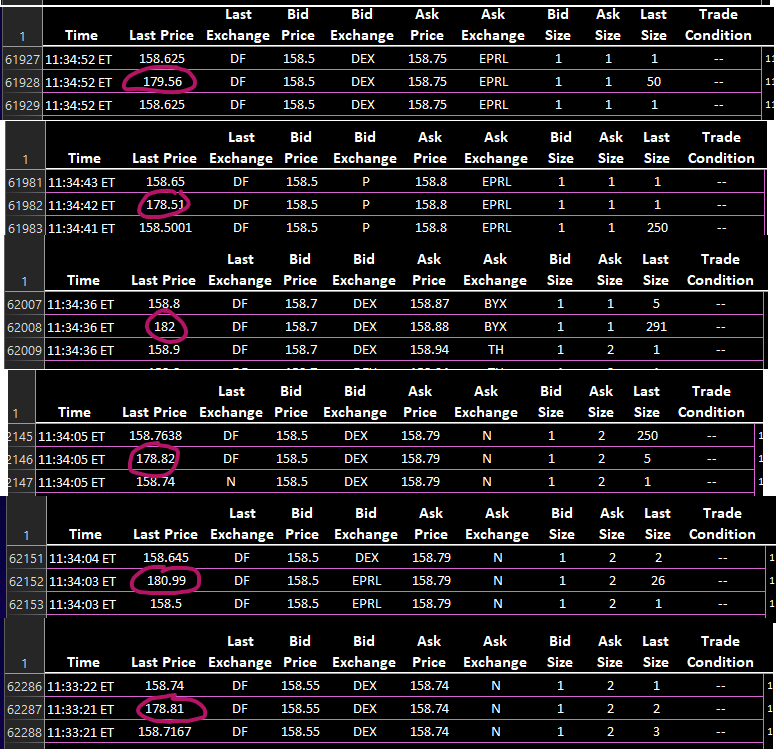
Well $28 outside the bid-ask range seems..... excessive? That's like if some dude said "I'll sell this thing for $158," everyone agrees, and then somehow he gets $186. Why doesn't my life work like that? Let's see all of these crazy trades up close:
Comparer avec l'anglais
nothing to see here?
Comparer avec l'anglais
That's all I've got for today. But now that I've got my spreadsheets all set up, I think I will continue to post revealing statistics until GME blasts off to the moon. Seems like a good way to pass the time?? 😈
Comparer avec l'anglais
TLDR: Either the matrix is glitching out or there's some really fucky shit going on.🚀🚀🚀
Comparer avec l'anglais
Selling puts on my computer's CPU.