Comparer avec l'anglais
Comparer avec l'anglais
Hello Superstonk! I am just compiling this for those of you that might be interested in the more juicy non-TA parts of my weekly DD's. Since a lot of this was written over several weeks, I wanted to get it all into one place for ease of reference. Any additional exit strategies or information will be added to this post in the future. For those of you that prefer the Video DD's they can still be found over on my YouTube. I know many of you have already read this but there is some new information here.
Comparer avec l'anglais
PART I: Where the hell is the Sell Button? or How to time Exits.
Comparer avec l'anglais
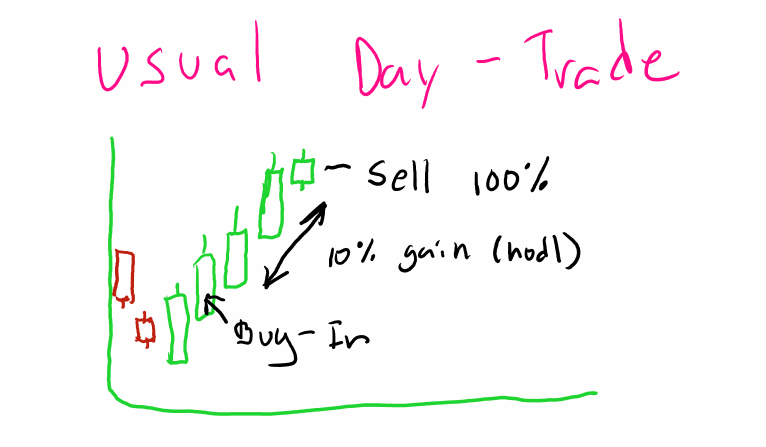
Well, I guess I'll begin by going over some things about me I am generally a day and on occasion a swing trader. Timing exits is a very important part of what I do everyday. GME is nothing like those positions... Normally if I hit 10% profit on a regular trade I'm out unless I have some previous reason to believe It will run further.
Comparer avec l'anglais
Usual Day Trade (Buy low, sell high)
Comparer avec l'anglais
GME WILL RUN FURTHER, MUCH FURTHER Well, how do you handle stocks when you expect the realized profits to be much higher? The answer to this is I usually don't. Day-trading should be defined by risk, My risk on this trade is 2% and my upside is cut at 10%. I'm not going to risk higher profits. I am simply going to take my money and walk away. If the stock goes up another 10% I don't care, as the trade is pre-defined. This makes talking about GME and exits a difficult discussion. As we expect GME to be a Black Swan type event there is no way to determine expected profits and the risk for most of us is the amount we put in. I believe most positions in GME, mine included, are a YOLO (a stock trade defined by maximum risk and maximum profit potential) . The mentality behind this is that by risking everything the reward should be much greater than that. We have seen a lot of numbers float around on GME over the last months on the expected price targets. It started at $1000 a share in January, then the unexpected halt of trading occurred during the initial squeeze, that number has since increased. Partly based on information that came to light on the short positions involved and partly on wild speculation we have seen price targets of $10,000, $69,420, $100,000, $420,069, $10,000,000, and more recently $100,000,000. While I like a lot of these numbers, the reality of the situation is...WE HAVE NO IDEA This would be an event not only unprecedented in the stock market but of such impact and volatility
Comparer avec l'anglais
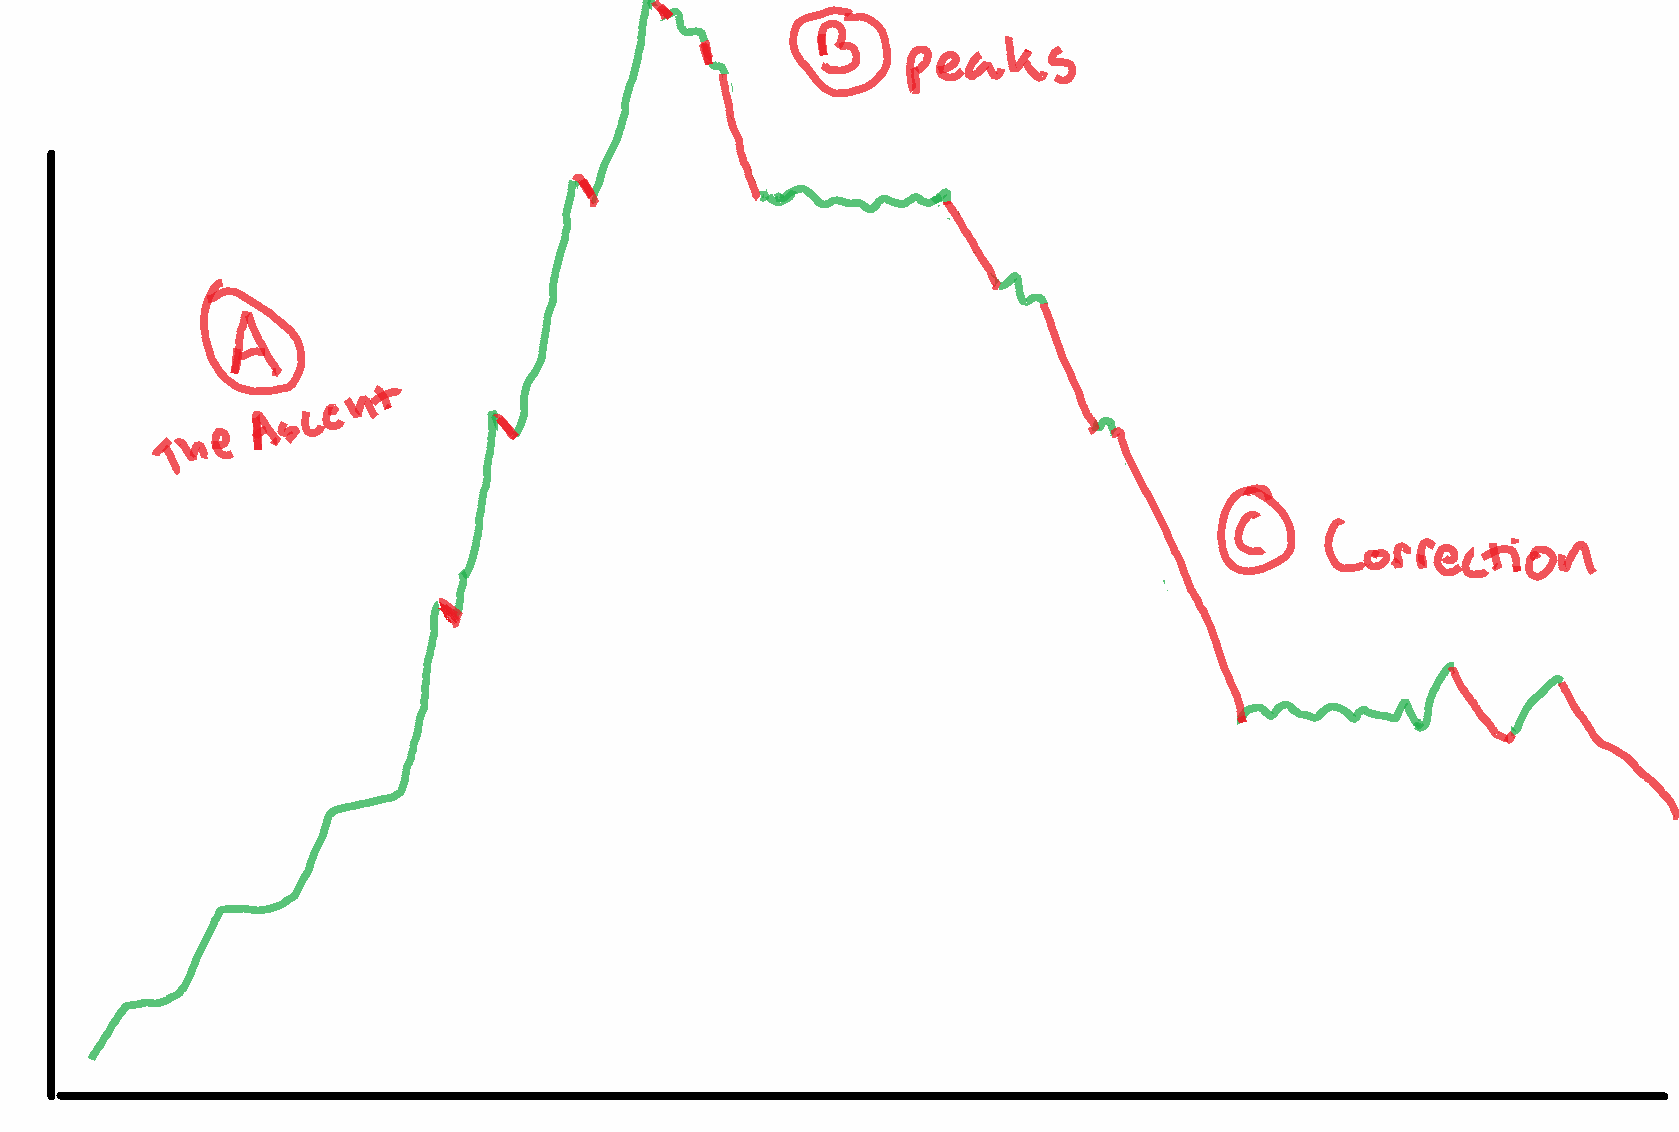
that it would be impossible to accurately predict any absolute price target. Sounds like FUD... No, to say X is a the absolute price target is silly and shows a lack of understanding how markets work. Will this stock be worth $10M ? Possibly? It could peak at $9,989,000 or $69,420,000. The point is this: WE HAVE NO IDEA, THIS HAS NEVER HAPPENED BEFORE! So this week between streaming and Live charting everyday I tried to think how can I help my fellow apes, no matter the smoothness of their brains, navigate such a tumultuous event. I had to ask myself Two questions. 1. How do you discuss exit strategy with no known price targets? 2. How do you make it simple enough to understand? I asked these two questions a lot and most of my answers fell short. I do believe I have finally settled on the easiest way to explain it and hopefully make it easier to understand. For this I'm going dig a little into the magical world of candlestick reading and pattern recognition. First thing all this will be defined at the 1-min timescale on the charts. I believe this timing will be most relevant in defining peaks. I will break this into sections and address each one.
Comparer avec l'anglais
3 Pillars of the Squeeze
Comparer avec l'anglais
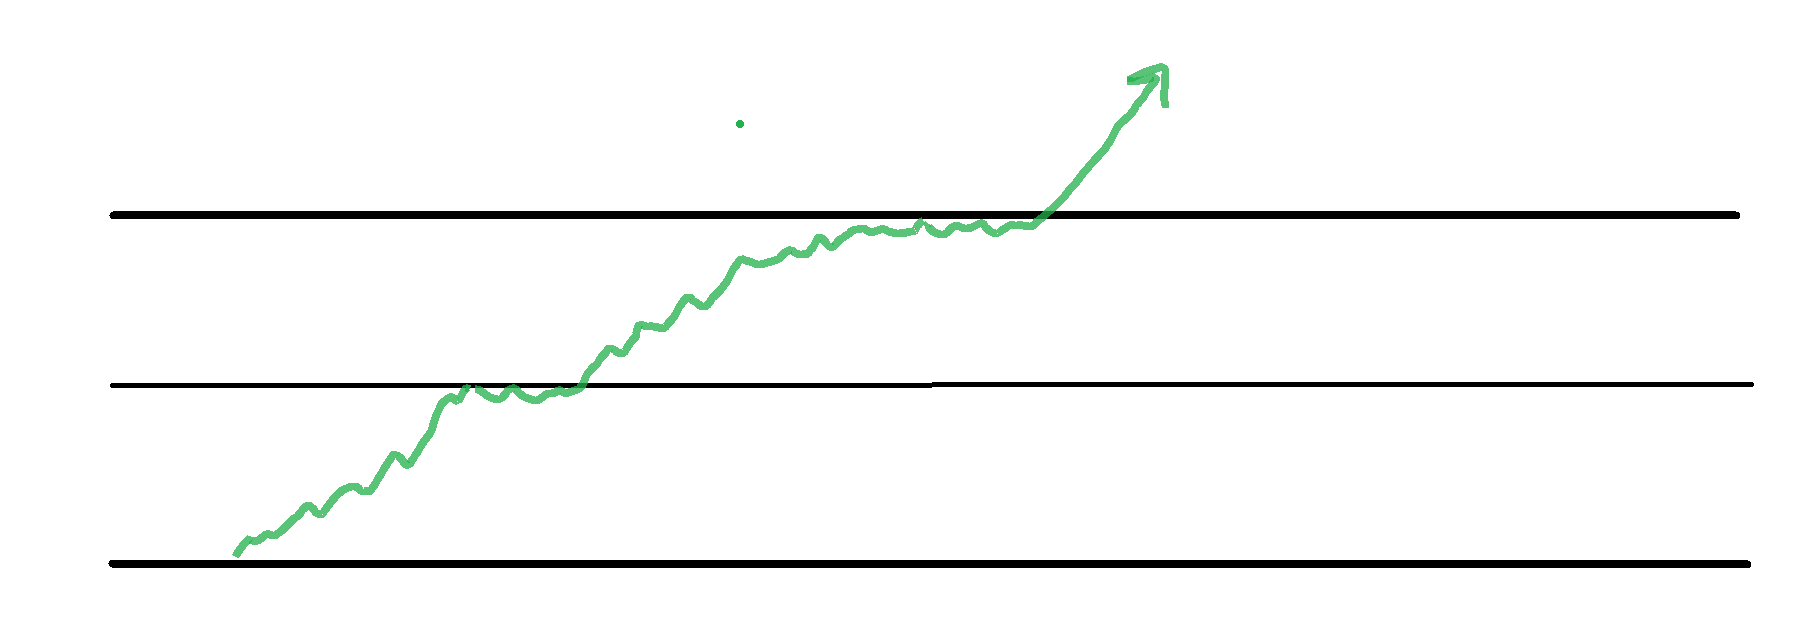
PART A: THE ASCENT Part I: Upwards Price Movement (We are here) This period will be marked by increasing upwards price movement, channel to channel, then periods of consolidation. This is normal price movement not necessarily volatile but it can be at times. This will be the movement as GME ascend upwards in the early stages.
Comparer avec l'anglais
Resistance-Test-Break-Repeat
Comparer avec l'anglais
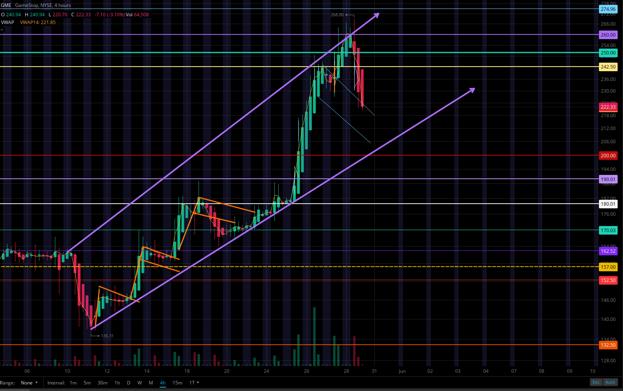
This period can take weeks, months, or minutes. We have seen in the past the price can jump very rapidly in some cases. The end of this stage will most likely be marked by faster and faster moves through these resistance levels. Bringing us to our next step in the ascent.
Comparer avec l'anglais
Current GME Chat on the 4HR Timescale
Comparer avec l'anglais
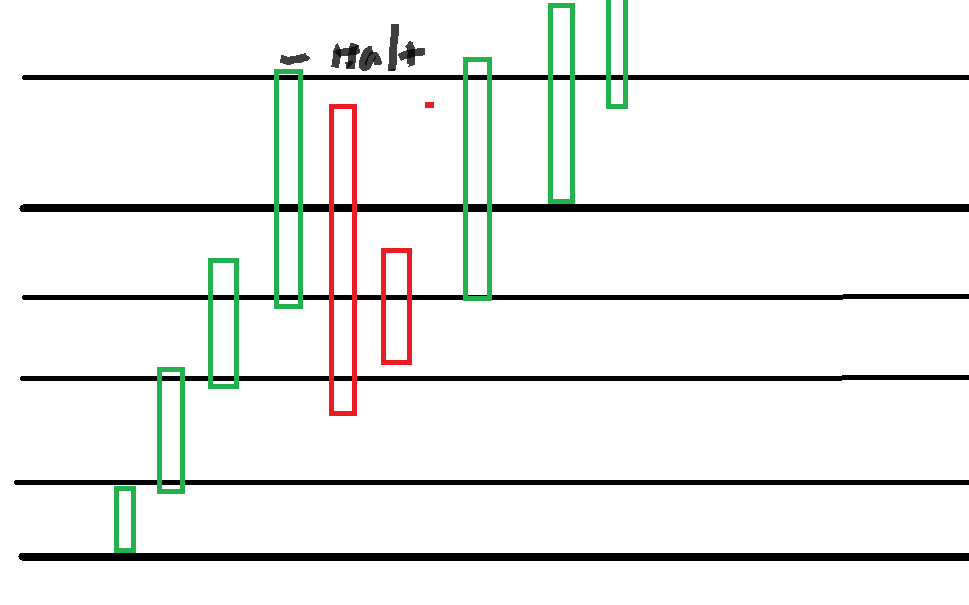
Part II: FOMO (Buckle up T - 10, 9, 8...) The faster and faster breaks in upper resistance levels are going to ignite interest in the stock, as large and small buyers rush in to capitalize on the squeeze. This is where fear begins to take affect as the price start moving quickly upwards some will be afraid of becoming a bag holder. Don't worry this is just the beginning. This Period will be marked by exponentially larger candles as volume rushes in and more price movement occurs in shorter and shorter time frames. There will be halts, there will be dips after those halts, as paper-hands, day-traders, and institutions cannibalize each other for small profits. Breath here, stay CALM. This period will mark the wildest price swings as volatility picks up. This will be the first pressure test of those Diamond Hands you've been bragging about.
Comparer avec l'anglais
Price rises into a Halt, then dips, quickly recovering to the upside
Comparer avec l'anglais
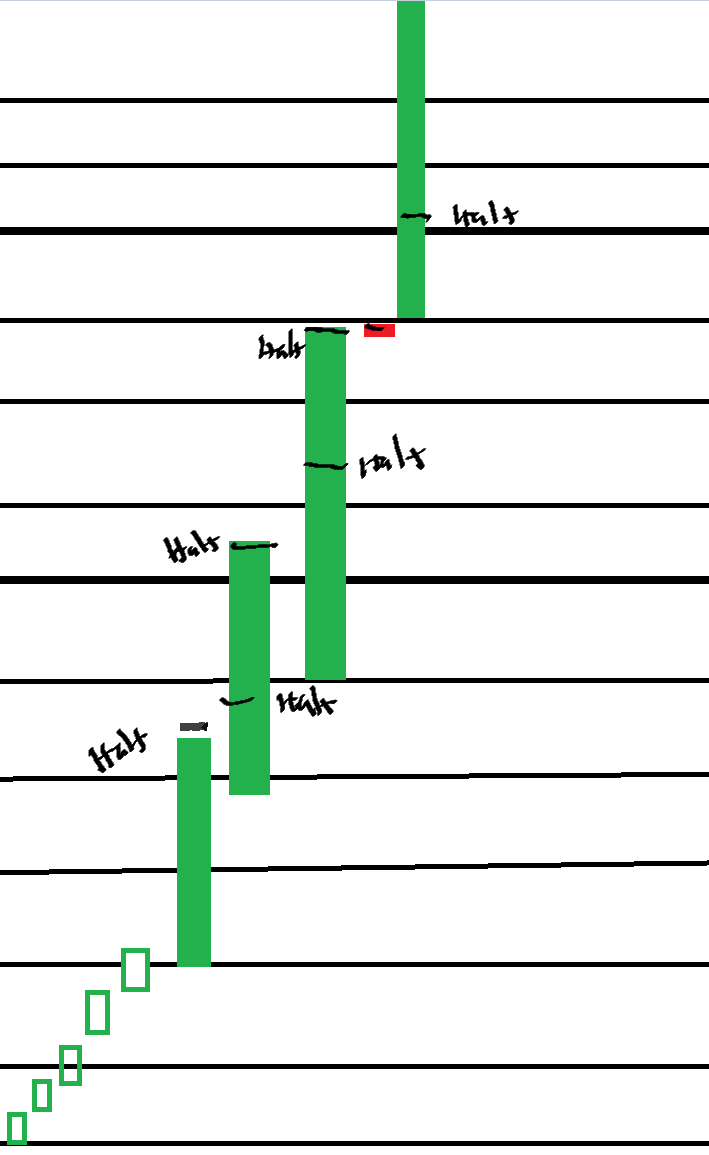
Part III: The Margin Calls (Lift Off) This is the moment everyone has been waiting the flight path to the moon! At some point we will hit a price, nobody knows what that price is, I estimate somewhere between 250 and 600, but may begin on some positions at a lower price. Whatever the price is, here is the moment that shorts must concede their position. The Margin Call will be marked by a significant number of halts and large green candles. The volume and range of these candles will increase dramatically from the previous stage. There will be many more halts, possibly on each candlestick, as the open market orders go un-filled the bid will continue to increase. So expect a pattern, of unhalt -rapid rise- halt. We will probably have more time halted than actual trading as the price explodes. Additionally, there should be very little red after the halts as upward pressure would be to great. Psychologically, this part will be easier as there is nothing to do but watch the brief periods of active trading closely. I expect this to go on for awhile, possibly days.
Comparer avec l'anglais
Expect many halts during this period these are absolutely normal and expected
Comparer avec l'anglais
PART B: THE PEAK
Comparer avec l'anglais
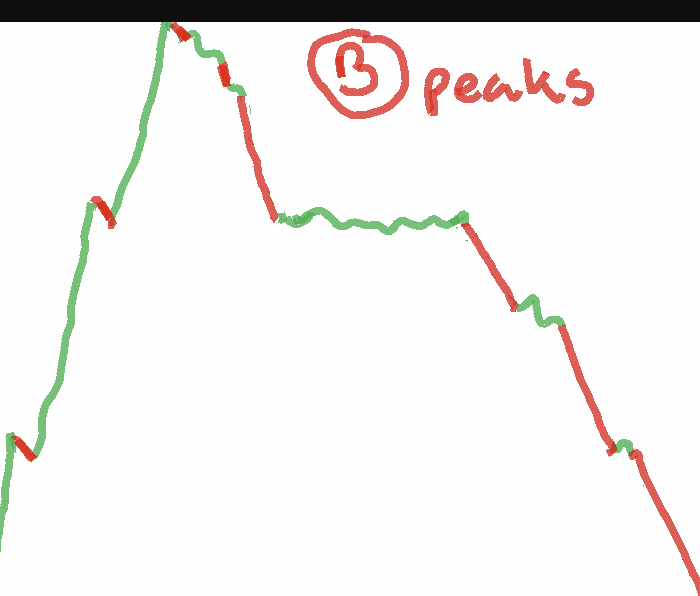
The Peaks
Comparer avec l'anglais
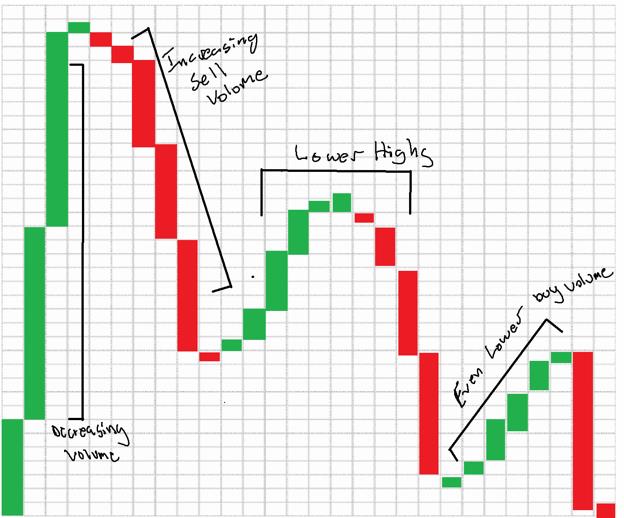
As all good things, even the Margin Call must come to an end at some point. So, how can this be identified? The first thing we will see is fewer halts and decreasing volume as we approach the peak. Some selling should be seen in here as holders attempt to time the peak. Large upwards movement, some selling, another upwards movement. After looking at VW (2008) and GME's small squeeze in January, I feel the breaking of the peak will be marked by a series of descending dogi's. Think of this as little booster rockets easing our descent onto the moon. decreasing in volume as apes finally begin their moon landing. Then patterns of large sells and smaller ascending candles. Lower highs, and lower lows. This is when an exit can start to be planned.
Comparer avec l'anglais
A period marked by decreasing volume, lower highs and lower lows. You will have time to confirm this, This is not the time to be impatient.
Comparer avec l'anglais
Given new information that has come to light since I wrote the original DD. I do believe that this stage will begin after the SI% has dropped to near 100%. So at this point I think that SHFs or their Insurers(DTCC, FED, etc...) will have covered via institutions and other holders all but the remaining retail positions. This entire stage is defined by apes negotiating power as we should be able to choose the price from here on out. This is where the all that hodl'ing pays off. Furthermore the length of time we stay in these peaks should be defined by the retail ownership, the longer we hodl the longer it lasts.
Comparer avec l'anglais
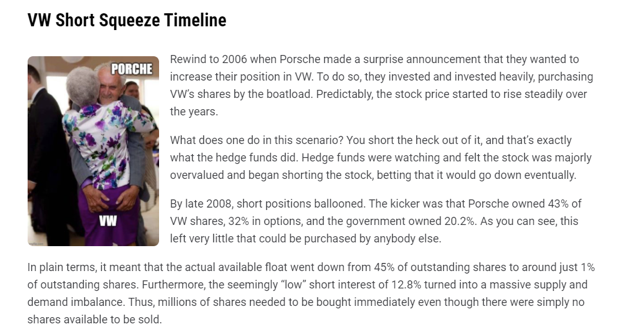
Apes are the Porsche/Government in the GME squeeze except we own more of the float and the SI is way, way higher...read this twice
Comparer avec l'anglais
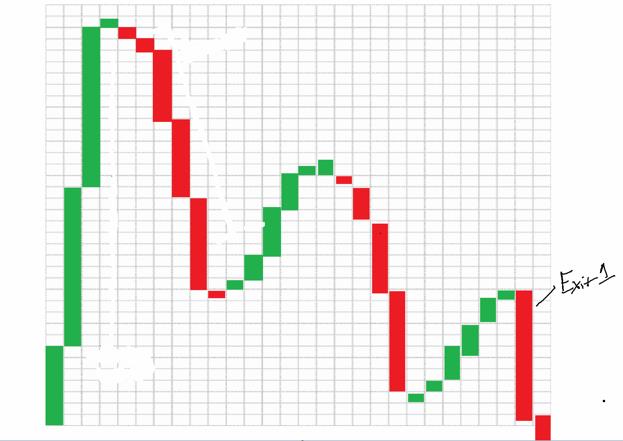
This is the first verifiable exit point at the apex of this wedge confirming a downtrend on the next candlestick. This is only the first of these patterns to play out.
Comparer avec l'anglais
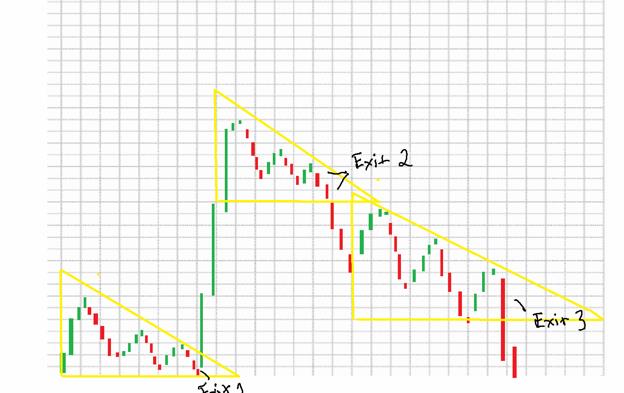
Several of these patterns should form as we remain in the peaks BE VERY CAREFUL HERE as selling all of a position at the first sign of a wedge forming can reduce potential profits. Why? Well because this wedge that formed above could break up.
Comparer avec l'anglais
Notice how after Exit 1 the price broke upwards. This is why it is less profitable to exit an entire position all at once. It's much more beneficial to slowly back out of a position at several points so as to maximize profit.
Comparer avec l'anglais
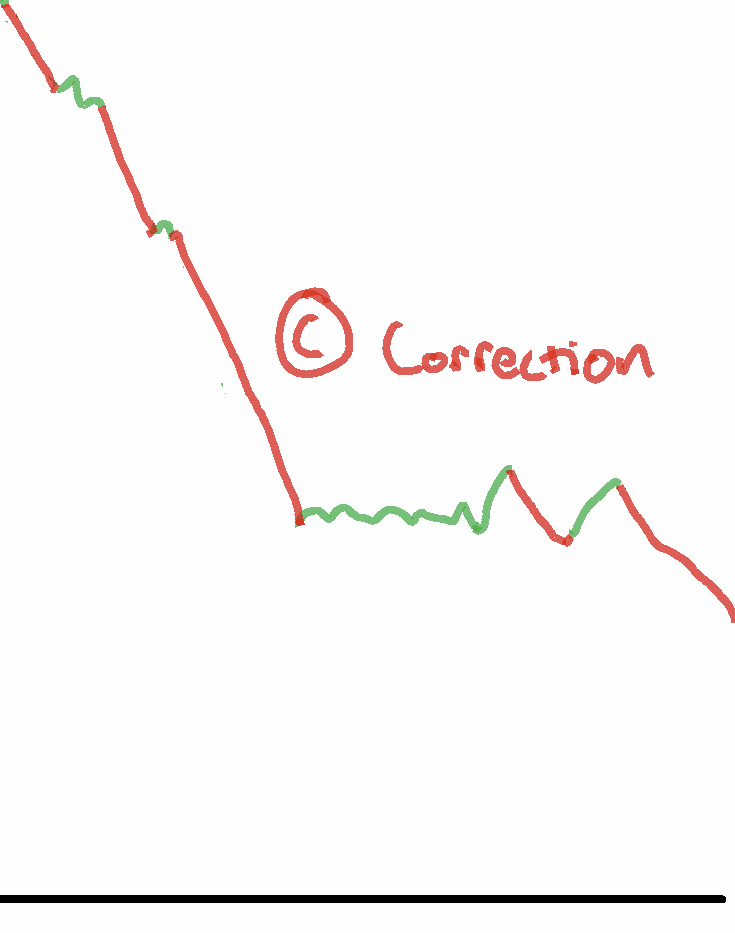
As this pattern continues eventually we will see larger and larger price decreases as each wedge breaks down and shorts are covered. This action will mark the beginning of the next phase. PART C: CORRECTION
Comparer avec l'anglais
This stage will be easily verifiable as massive decreases in price will occur between halts very similar to the Margin Call stage but in reverse this is the last opportunity to exit remaining positions at high amounts.
Comparer avec l'anglais
As the larger and larger price drops pick up steam, there will be more halts. Once these large sell offs are confirmed this is the point at which you hope all your positions are closed (I will be holding 10% forever so the x and xx apes can maximize returns, and morbid curiosity). We are returning to earth so we can spend all the tendies we picked-up on that moon landing. The price will begin it's descent back to levels previously traded at and possibly lower. This could be the last dip-buy in GME's history. If you are long GME as I am, this will present an opportunity to get back in on a company that I believe has a bright and profitable future.
Comparer avec l'anglais
Part II: Execution During High Volatility
Comparer avec l'anglais
First I would like to address the issues that can arise during a squeeze, some of these may have a greater effect on retail investors.
Comparer avec l'anglais
• Delays - volatile markets are generally associated with high volume an this can causeComparer avec l'anglais
delays in execution. As online traders expect to sell at near the price listed on the screen, remember this isn't always the case.
Comparer avec l'anglais
• System Issues - Everyone is familiar with this, as many online investors had issues inComparer avec l'anglais
January. Sometimes the system is overloaded. Investors may have difficulty accessing their accounts as traffic ramps up. Remember that if you experience these issues many brokers offer alternatives such as phone trades or live brokers to help facilitate order execution. I urge people to investigate your brokers options now, to best prepare for this.
Comparer avec l'anglais
• Incorrect Quotes - Even the best real-time quoting systems fall prey to this. I like toComparer avec l'anglais
think of it as lag in video game. The size of the quote (#of shares at a certain price) can change rapidly, affecting the likelihood of quote availability.
Comparer avec l'anglais
• Algorithms - Algorithmic trading can actually exacerbate volatility. There is a niceComparer avec l'anglais
article on it here for further reading. So, how do we navigate this? I don't think there is a perfect answer. If any human could time and predict volatility perfectly they would be exceedingly wealthy, we wouldn't have automated almost all of the financial markets, and I wouldn't be having this conversation. Like most things, the answer lies in learning. I truly believe that the best way to understand something is to turn information into knowledge. When you have knowledge of a thing, it is harder to be surprised, as it will already tie into knowledge you have, giving you a basis for understanding. The system for this type of learning is called the Feynman Learning Technique. I have attempted to use this in all my DD up till this point, and will continue to do so. The best way to address most of these tense questions is to give people knowledge and understanding. That way, when faced with the actual issue, they will be able to address it with confidence that comes only from understanding. So here are the order types and their pros and cons.
Comparer avec l'anglais
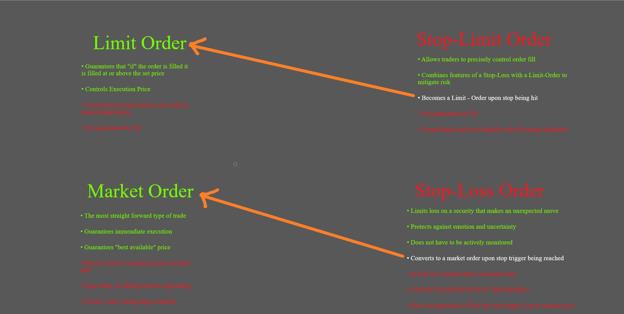
• Limit Order - A limit order is an order to sell a security at a specified price or "better"Comparer avec l'anglais
• Market Order - An order to buy or sell stock at the "best available" priceComparer avec l'anglais
• Stop-Limit Order - A conditional trade that combines features of a Limit Order withComparer avec l'anglais
the risk mitigation of a stop-loss
Comparer avec l'anglais
• Stop-Loss Order - An order placed that converts to a "market order" when a set price isComparer avec l'anglais
reached I suggest that everyone read these links this is important information to understand. Also this one.
Comparer avec l'anglais
Pros and Cons of Each Order type. This does not reflect best use during MOASS.
Comparer avec l'anglais
This is simply to illuminate a confusing topic. Hoping that the knowledge of the order types will best prepare people for using them appropriately. As each one has their place.
Comparer avec l'anglais
Part III: Position Breakdown (New)
Comparer avec l'anglais
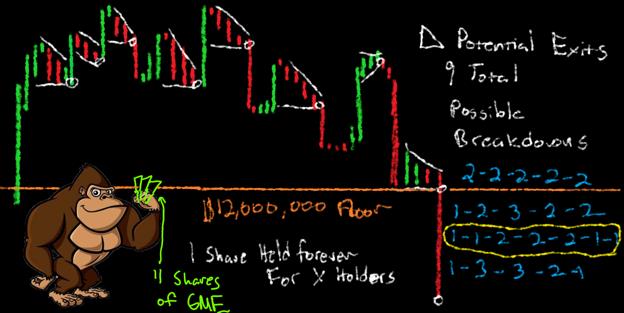
How does one break down a position instead of exiting all at once. This is a question I get asked a lot and the answer is pretty straight forward. I think it applies to every position size whether your x or xxxx it's irrelevant. You want to maximize your number of available exits above your personal floor. So here is an example an ape. The ape has 11 shares and a personal floor of $12M
Comparer avec l'anglais
The best breakdown is highlighted as it creates the highest possible number of exit points, This same strategy applies no matter the size of your position. You can break it down by whole numbers percentages whatever you want.
Comparer avec l'anglais
Everyone should practice breaking down their own positions. Take some time to figure out how to break down your own position most effectively. My breakdown is: 5% - 10% - 15% - 15% - 20% - 15% -10% and then holding 10% forever
Comparer avec l'anglais
Part IV: Conclusion
Comparer avec l'anglais
I hope this helps everyone get all the information I've put out in one place. If I add any addition exit information it will be posted here as well and I will keep this post pinned to my Profile until after MOASS. If you guys have any questions feel free to post below as always I will try to get to all of them. If you want to see more information on this subject matter feel free to join me in the : Daily Live charting on r/Superstonk from 9am - 4pm EST on trading days On YouTube Live Streams from 9am - 4pm on trading days Or over on the Discord or for memes and other fun stuff on r/dillionaires As always thank you for the support 🦍❤️ - Gherkinit * For those that only read the first paragraph. I in no way endorse day-trading of GME not only does it present significant risk, it can delay the squeeze. *This is not Financial advice. The ideas and opinions expressed here are for educational and entertainment purposes only. No position is worth your life and debt can always be repaid. Please if you need help reach out this community is here for you. Also the NSPL Phone: 800-273-8255 Hours: Available 24 hours. Languages: English, Spanish. Learn more